

AAPL trades flat as consolidation near $346.65 reflects muted momentum

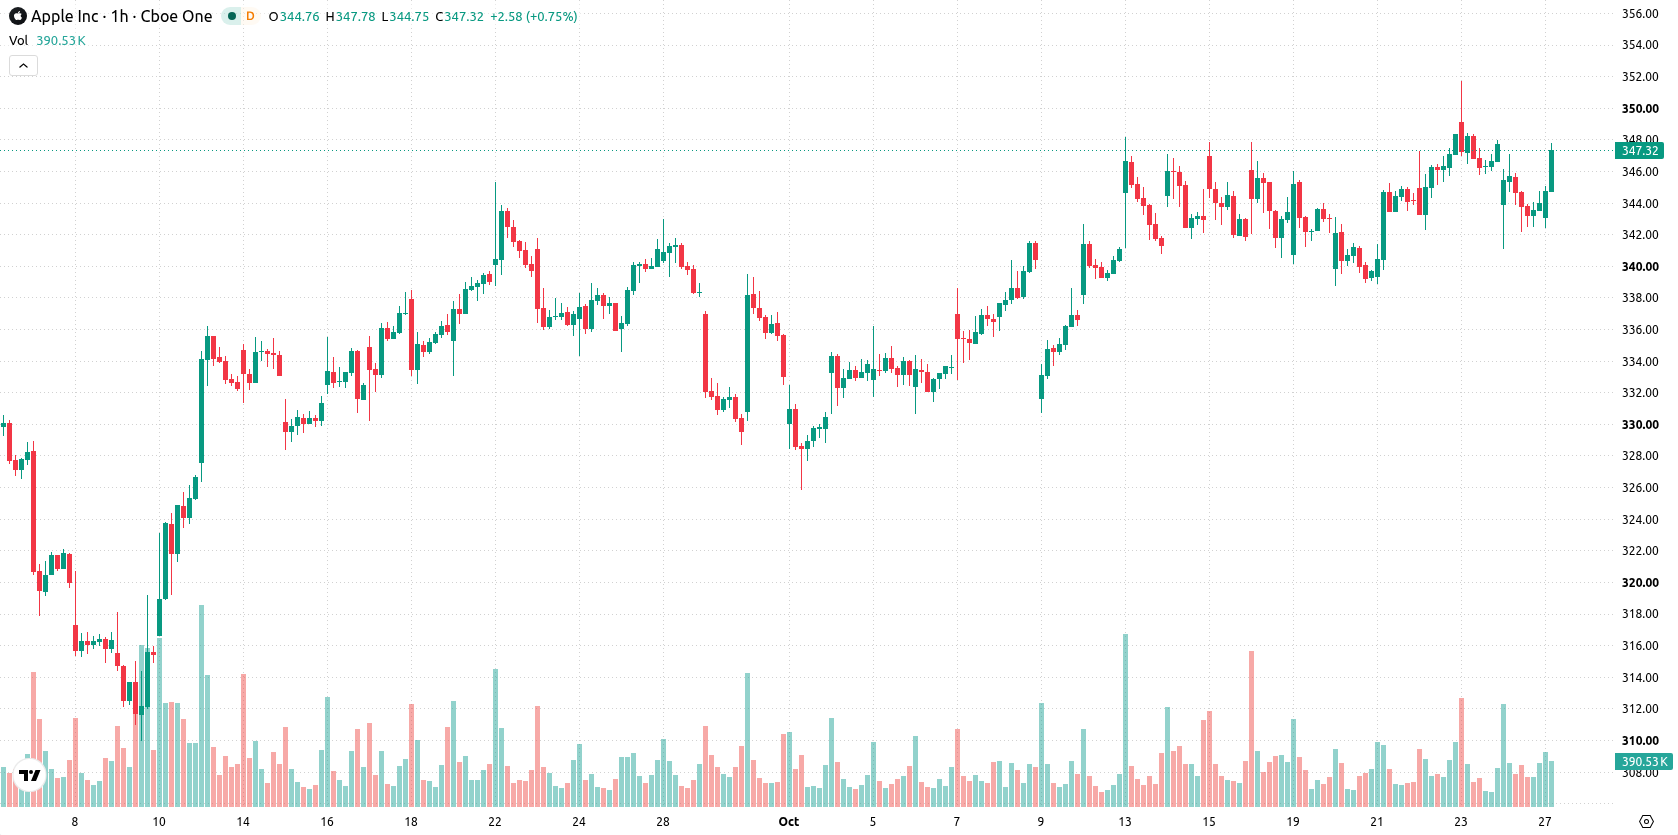
Apple Inc. (AAPL) stock is trading at $346.65, recording a modest intraday gain. The price sits above its key moving averages on short, medium, and long-term horizons.
 343.78
350.58
Highlights
- Apple has addressed 163 security vulnerabilities in iOS 27.2 and iPadOS 27.2, enhancing device security and reinforcing customer retention.
- The company identified and remedied 329 unique vulnerabilities across its operating systems and raised iPhone Duo shipment targets on strong preorder activity.
- Apple stock trades within a $341.37 to $351.93 range, with technicals showing bearish signals and a 68% probability of further downside.
Customer retention seen improving as Apple addresses security flaws
Apple released iOS 27.2 and iPadOS 27.2 on October 26, 2026, addressing 163 security vulnerabilities on newer iPhone and iPad devices, which bolsters device security and is likely to strengthen long-term customer retention according to Cybersecuritynews. In parallel, 9to5mac reported that the company has remedied 329 unique vulnerabilities across its full suite of operating systems, highlighting a broad-based effort at risk reduction and proactive compliance. Separately, Apple has raised its iPhone Duo shipment targets following robust preorder activity despite display-related challenges, as noted by Digitimes, suggesting underlying demand strength for its latest devices.
Support base affirmed as momentum turns increasingly bearish
AAPL currently holds above the MA-20 at $345.89 and MA-50 at $344.09 on the hourly chart, with the long-term MA-200 at $294.84 on the daily chart reinforcing an established technical support base. The Ichimoku Kijun sits at $346.38, acting as a nearby floor, while immediate support and resistance levels are identified at $341.37 and $351.93, respectively. In terms of momentum, MACD remains Neutral, while ADX and Awesome Oscillator signal Sell, indicating ongoing but muted downside risk. Both RSI at 47.18 and CCI remain in Sell territory, with Stochastic RSI Neutral and Bull/Bear Power showing intraday oversold conditions, reflecting prevailing seller pressure.
Range-bound outlook persists amid limited breakout prospects
In the short term, AAPL is expected to consolidate within a typical volatility band defined by $341.37 to $351.93. A break above $351.93 would open the path for further recovery and testing of higher resistance, but the probability of such an upside move is limited to 32%. Conversely, a move below immediate support at $341.37 would indicate growing downside risk with a higher likelihood of short-term retracement. The baseline scenario calls for continued range-bound trading as the market digests the current technical and fundamental landscape.
Earlier, analysts noted that Apple remained fundamentally resilient, but faced pressures from declining iPhone sales in key markets and ongoing cost challenges amid profit-taking. The current technical setup suggests that traders should closely monitor the $351.93 resistance level, as a sustained break above it could signal a shift from the prevailing range-bound scenario to a renewed recovery trend.










-
 Afghanistan
-
 Albania
-
 Algeria
-
 Angola
-
 Argentina
-
 Armenia
-
 Australia
-
 Austria
-
 Azerbaijan
-
 Bahamas
-
 Bahrain
-
 Bangladesh
-
 Belarus
-
 Belgium
-
 Bolivia
-
 Botswana
-
 Brazil
-
 Brunei
-
 Bulgaria
-
 Cambodia
-
 Cameroon
-
 Canada
-
 Chile
-
 China
-
 Colombia
-
 Congo
-
 Costa Rica
-
 Cote d'Ivoire
-
 Croatia
-
 Cuba
-
 Cyprus
-
 Czechia
-
 DR Congo
-
 Denmark
-
 Dominican Republic
-
 Ecuador
-
 Egypt
-
 El Salvador
-
 Estonia
-
 Eswatini
-
 Ethiopia
-
 Finland
-
 France
-
 Georgia
-
 Germany
-
 Ghana
-
 Greece
-
 Haiti
-
 Hong Kong
-
 Hungary
-
 India
-
 Indonesia
-
 Iran, Islamic republic
-
 Iraq
-
 Ireland
-
 Israel
-
 Italy
-
 Jamaica
-
 Japan
-
 Jordan
-
 Kazakhstan
-
 Kenya
-
 Korea
-
 Kuwait
-
 Kyrgyzstan
-
 Laos
-
 Latvia
-
 Lebanon
-
 Lesotho
-
 Libya
-
 Lithuania
-
 Luxembourg
-
 Madagascar
-
 Malaysia
-
 Malta
-
 Mauritius
-
 Mexico
-
 Moldova
-
 Mongolia
-
 Montenegro
-
 Morocco
-
 Mozambique
-
 Myanmar
-
 Namibia
-
 Nepal
-
 Netherlands
-
 New Zealand
-
 Nigeria
-
 North Macedonia
-
 Norway
-
 Oman
-
 Pakistan
-
 Palestine
-
 Panama
-
 Papua New Guinea
-
 Paraguay
-
 Peru
-
 Philippines
-
 Poland
-
 Portugal
-
 Puerto Rico
-
 Qatar
-
 Reunion
-
 Romania
-
 Rwanda
-
 Saudi Arabia
-
 Serbia
-
 Singapore
-
 Slovakia
-
 Slovenia
-
 Somalia
-
 South Africa
-
 Spain
-
 Sri Lanka
-
 Sweden
-
 Switzerland
-
 Syria
-
 Taiwan
-
 Tajikistan
-
 Tanzania
-
 Thailand
-
 Trinidad and Tobago
-
 Tunisia
-
 Turkey
-
 UAE
-
 Uganda
-
 Ukraine
-
 United Kingdom
-
United States
-
 Uruguay
-
 Uzbekistan
-
 Venezuela
-
 Vietnam
-
 Yemen
-
 Zambia
-
 Zimbabwe
- Forex
- Crypto












