

AFRM climbs as upward price move faces $72.18 resistance

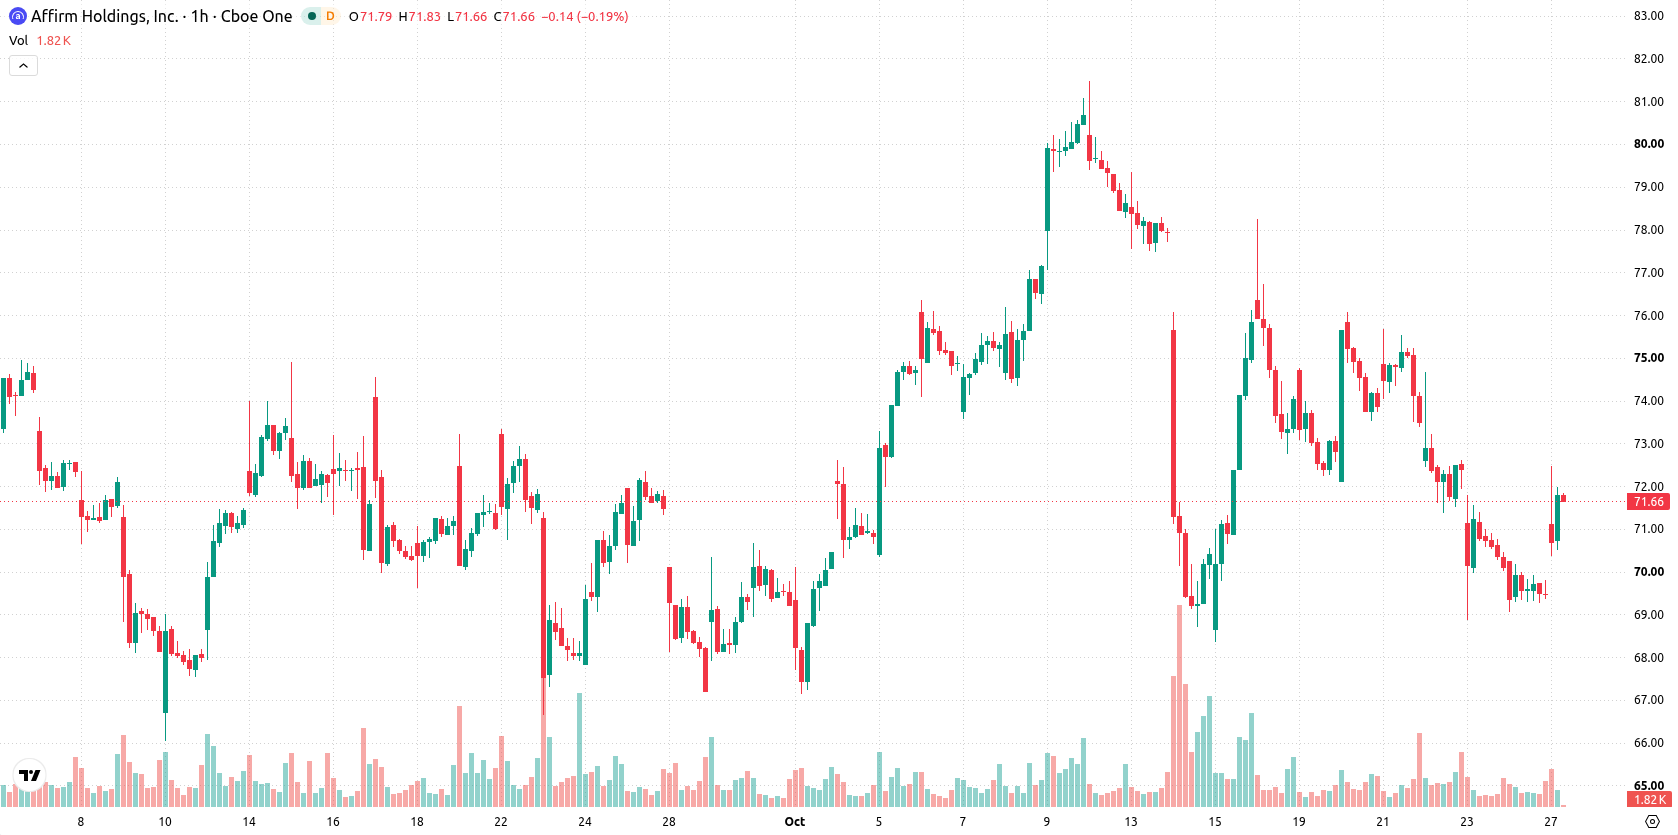
Affirm Holdings (AFRM) stock is trading at $71.9 after climbing 3.55% for the day. The price now sits above its key short- and long-term moving averages, with near-term strength but a pause relative to the medium-term trend.
 77.90
76.13
Highlights
- Affirm Holdings will present at upcoming investor conferences, increasing management exposure to institutional and retail audiences.
- These appearances offer Affirm management a direct forum to outline strategic priorities and operational outlook to the investment community.
- Affirm stock gained 3.55% to $71.9, trades in a $68.95 to $74.85 range, with technical indicators showing negative momentum and a slight probability of downside.
Management visibility rises amid investor conferences and strategy focus
Affirm Holdings is set to participate in upcoming investor conferences, according to Financialcontent, increasing its direct engagement with the investment community and offering management a platform to highlight strategic initiatives. Such appearances can facilitate greater understanding of Affirm's growth outlook and operational performance among institutional and retail audiences. Heightened management visibility often attracts fresh market interest and can play a role in short-term price moves.
Sell momentum persists as resistance coincides with mixed technical signals
The price is currently above the MA-20 and MA-200, while remaining below the MA-50. Closest technical levels include the Ichimoku Kijun at $72.18, acting as immediate resistance. Momentum indicators are broadly negative: MACD and ADX point to a sell bias, with RSI, CCI, and Bull/Bear Power all indicating seller dominance and an oversold setup. Stochastic RSI alone signals a potential buy, while the Awesome Oscillator is neutral, highlighting a notable divergence among oscillators as upward price action is not fully corroborated by underlying momentum.
Downside bias grows with consolidation inside volatility range
Over the near term, AFRM is expected to consolidate within a volatility band between $68.95 and $74.85. The probability model assigns a modestly higher chance (52%) for a downward move versus 48% for an advance. This produces a baseline scenario where price consolidates inside the corridor; a breakout above $72.18 would set up a test of the upper range, while a drop below $68.95 would signal renewed selling pressure and extend downside risk.
Earlier, analysts noted Affirm was maintaining an upward bias within a defined trading range, with mixed momentum signals and macroeconomic influences contributing to a balanced yet cautiously optimistic outlook. With new management visibility from upcoming investor events and a shift in technical conditions, traders should now watch the $72.18 resistance as a pivotal level that could determine whether short-term consolidation resolves with renewed strength or increased downside risk.










-
 Afghanistan
-
 Albania
-
 Algeria
-
 Angola
-
 Argentina
-
 Armenia
-
 Australia
-
 Austria
-
 Azerbaijan
-
 Bahamas
-
 Bahrain
-
 Bangladesh
-
 Belarus
-
 Belgium
-
 Bolivia
-
 Botswana
-
 Brazil
-
 Brunei
-
 Bulgaria
-
 Cambodia
-
 Cameroon
-
 Canada
-
 Chile
-
 China
-
 Colombia
-
 Congo
-
 Costa Rica
-
 Cote d'Ivoire
-
 Croatia
-
 Cuba
-
 Cyprus
-
 Czechia
-
 DR Congo
-
 Denmark
-
 Dominican Republic
-
 Ecuador
-
 Egypt
-
 El Salvador
-
 Estonia
-
 Eswatini
-
 Ethiopia
-
 Finland
-
 France
-
 Georgia
-
 Germany
-
 Ghana
-
 Greece
-
 Haiti
-
 Hong Kong
-
 Hungary
-
 India
-
 Indonesia
-
 Iran, Islamic republic
-
 Iraq
-
 Ireland
-
 Israel
-
 Italy
-
 Jamaica
-
 Japan
-
 Jordan
-
 Kazakhstan
-
 Kenya
-
 Korea
-
 Kuwait
-
 Kyrgyzstan
-
 Laos
-
 Latvia
-
 Lebanon
-
 Lesotho
-
 Libya
-
 Lithuania
-
 Luxembourg
-
 Madagascar
-
 Malaysia
-
 Malta
-
 Mauritius
-
 Mexico
-
 Moldova
-
 Mongolia
-
 Montenegro
-
 Morocco
-
 Mozambique
-
 Myanmar
-
 Namibia
-
 Nepal
-
 Netherlands
-
 New Zealand
-
 Nigeria
-
 North Macedonia
-
 Norway
-
 Oman
-
 Pakistan
-
 Palestine
-
 Panama
-
 Papua New Guinea
-
 Paraguay
-
 Peru
-
 Philippines
-
 Poland
-
 Portugal
-
 Puerto Rico
-
 Qatar
-
 Reunion
-
 Romania
-
 Rwanda
-
 Saudi Arabia
-
 Serbia
-
 Singapore
-
 Slovakia
-
 Slovenia
-
 Somalia
-
 South Africa
-
 Spain
-
 Sri Lanka
-
 Sweden
-
 Switzerland
-
 Syria
-
 Taiwan
-
 Tajikistan
-
 Tanzania
-
 Thailand
-
 Trinidad and Tobago
-
 Tunisia
-
 Turkey
-
 UAE
-
 Uganda
-
 Ukraine
-
 United Kingdom
-
United States
-
 Uruguay
-
 Uzbekistan
-
 Venezuela
-
 Vietnam
-
 Yemen
-
 Zambia
-
 Zimbabwe
- Forex
- Crypto












