

What's behind GSK's latest 4.2% stock pullback?

GSK plc (GSK) slumped 4.22% today after a downside gap, even as the company delivered solid third-quarter results and raised its dividend. The move is supported by a bearish technical structure, with the share price trading above the 20-day moving average but remaining under longer-term pressure below the 50- and 200-day moving averages.
 1887.50
1913.50
Highlights
- GSK plc reported third quarter sales of £8.9 billion with specialty medicines revenue increasing 15% year over year.
- The company booked a £328 million restructuring charge as part of a program aiming for £1.9 billion in annual savings by 2029 and raised its dividend to 17p per share.
- Shares of GSK closed at GBX1,838 after dropping 4.22%, trading in a narrowing corridor with overbought signals and a projected five-day range of GBX1,803 to GBX1,923.
Growth in specialty medicines offset by restructuring costs and pipeline focus
GSK plc reported financial results for the third quarter of 2026, with sales of £8.9 billion and specialty medicines sales growing 15%. The period included a £328 million restructuring charge as part of the Accelerate Growth program, aimed at annual savings of £1.9 billion by 2029. Core operating profit and core earnings per share both increased compared to the previous year, and the company raised its dividend to 17p per share. Recent investor updates highlighted new oncology data and expansion of the drug pipeline, though price action has remained under broader selling pressure.
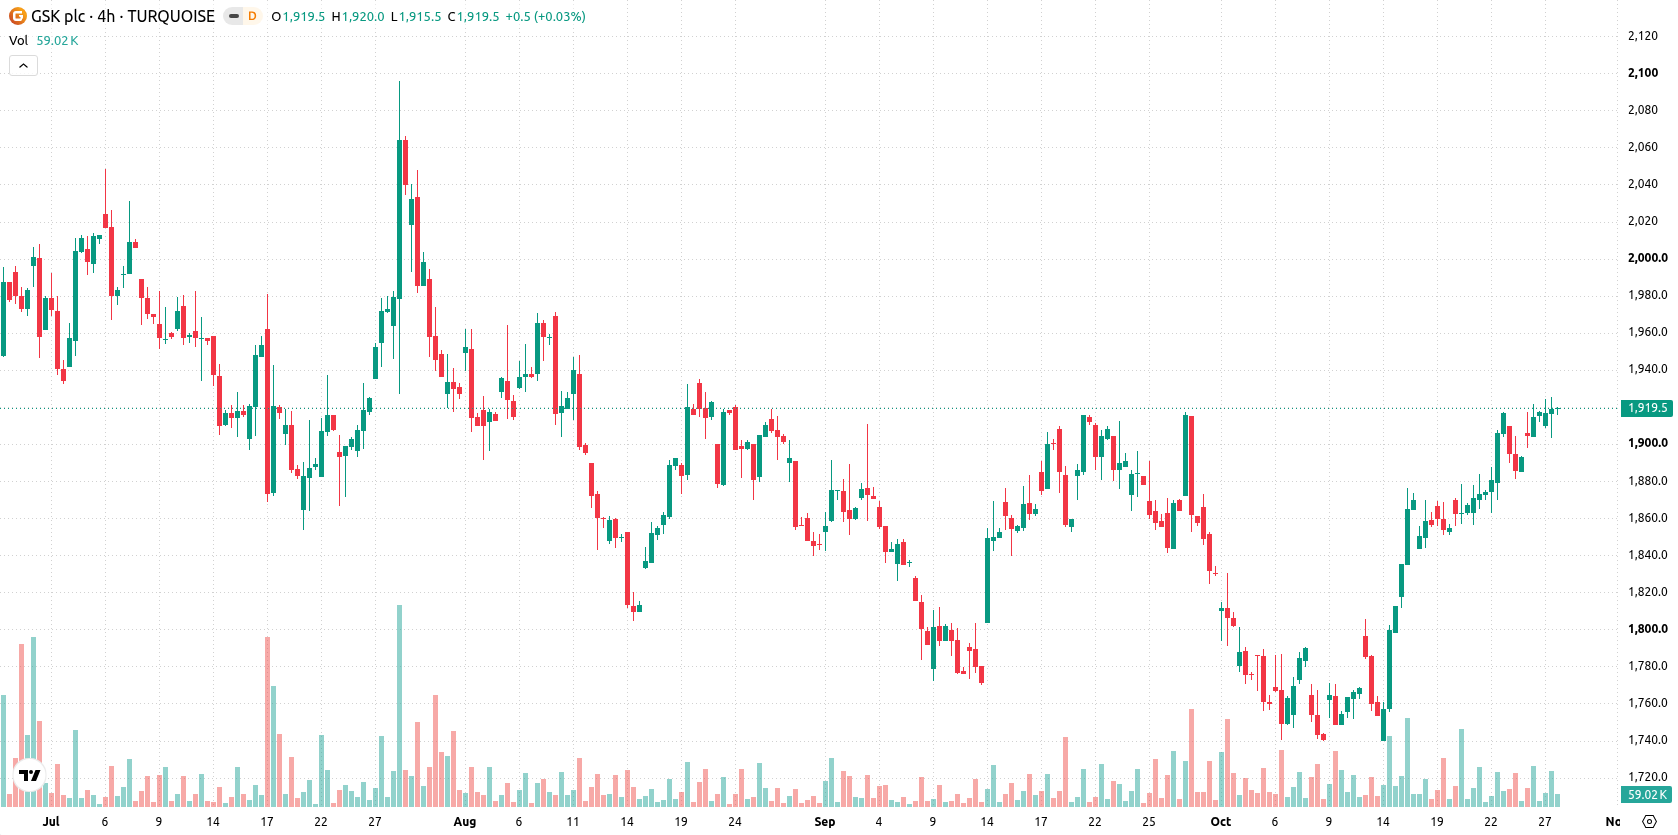
Mixed momentum and overbought signals cap short-term rebound
GSK is trading above the 20-day moving average (GBX1,826), but remains below the 50-day (GBX1,850) and 200-day (GBX1,951) moving averages, reflecting short-term strength amid continuing medium- and long-term selling pressure. Support is seen at the Ichimoku Kijun level (GBX1,832), while resistance stands at the 50-day moving average (GBX1,850), with the prevailing long-term trend confirmed as bearish. Momentum signals are mixed: the MACD shows a bullish bias, the ADX points to a neutral trend, and the RSI is firm at 62.18, signaling a buy. However, both the Stochastic RSI (97.28) and CCI (118.08) indicate overbought conditions, with Bull/Bear Power confirming buyer dominance but also signaling overbought. The Awesome Oscillator is in buy territory, supporting continued bullish momentum. Intraday volatility is at 1.18%, with price action close to the day’s low and pressure evident after the open due to a divergence between overbought oscillators and positive momentum indicators.
Earlier, analysts noted that GSK was exhibiting mixed technical signals amid ongoing consolidation and fresh pipeline developments. With the current bearish structure placing the stock below key longer-term averages despite recent earnings strength, traders should watch for a move above GBX1,850 or below GBX1,832 for the next directional signal.






Latest GSK News





-
 Afghanistan
-
 Albania
-
 Algeria
-
 Angola
-
 Argentina
-
 Armenia
-
 Australia
-
 Austria
-
 Azerbaijan
-
 Bahamas
-
 Bahrain
-
 Bangladesh
-
 Belarus
-
 Belgium
-
 Bolivia
-
 Botswana
-
 Brazil
-
 Brunei
-
 Bulgaria
-
 Cambodia
-
 Cameroon
-
 Canada
-
 Chile
-
 China
-
 Colombia
-
 Congo
-
 Costa Rica
-
 Cote d'Ivoire
-
 Croatia
-
 Cuba
-
 Cyprus
-
 Czechia
-
 DR Congo
-
 Denmark
-
 Dominican Republic
-
 Ecuador
-
 Egypt
-
 El Salvador
-
 Estonia
-
 Eswatini
-
 Ethiopia
-
 Finland
-
 France
-
 Georgia
-
 Germany
-
 Ghana
-
 Greece
-
 Haiti
-
 Hong Kong
-
 Hungary
-
 India
-
 Indonesia
-
 Iran, Islamic republic
-
 Iraq
-
 Ireland
-
 Israel
-
 Italy
-
 Jamaica
-
 Japan
-
 Jordan
-
 Kazakhstan
-
 Kenya
-
 Korea
-
 Kuwait
-
 Kyrgyzstan
-
 Laos
-
 Latvia
-
 Lebanon
-
 Lesotho
-
 Libya
-
 Lithuania
-
 Luxembourg
-
 Madagascar
-
 Malaysia
-
 Malta
-
 Mauritius
-
 Mexico
-
 Moldova
-
 Mongolia
-
 Montenegro
-
 Morocco
-
 Mozambique
-
 Myanmar
-
 Namibia
-
 Nepal
-
 Netherlands
-
 New Zealand
-
 Nigeria
-
 North Macedonia
-
 Norway
-
 Oman
-
 Pakistan
-
 Palestine
-
 Panama
-
 Papua New Guinea
-
 Paraguay
-
 Peru
-
 Philippines
-
 Poland
-
 Portugal
-
 Puerto Rico
-
 Qatar
-
 Reunion
-
 Romania
-
 Rwanda
-
 Saudi Arabia
-
 Serbia
-
 Singapore
-
 Slovakia
-
 Slovenia
-
 Somalia
-
 South Africa
-
 Spain
-
 Sri Lanka
-
 Sweden
-
 Switzerland
-
 Syria
-
 Taiwan
-
 Tajikistan
-
 Tanzania
-
 Thailand
-
 Trinidad and Tobago
-
 Tunisia
-
 Turkey
-
 UAE
-
 Uganda
-
 Ukraine
-
 United Kingdom
-
United States
-
 Uruguay
-
 Uzbekistan
-
 Venezuela
-
 Vietnam
-
 Yemen
-
 Zambia
-
 Zimbabwe
- Forex
- Crypto












