

HSBA falls as seller pressure weighs on HSBC stock

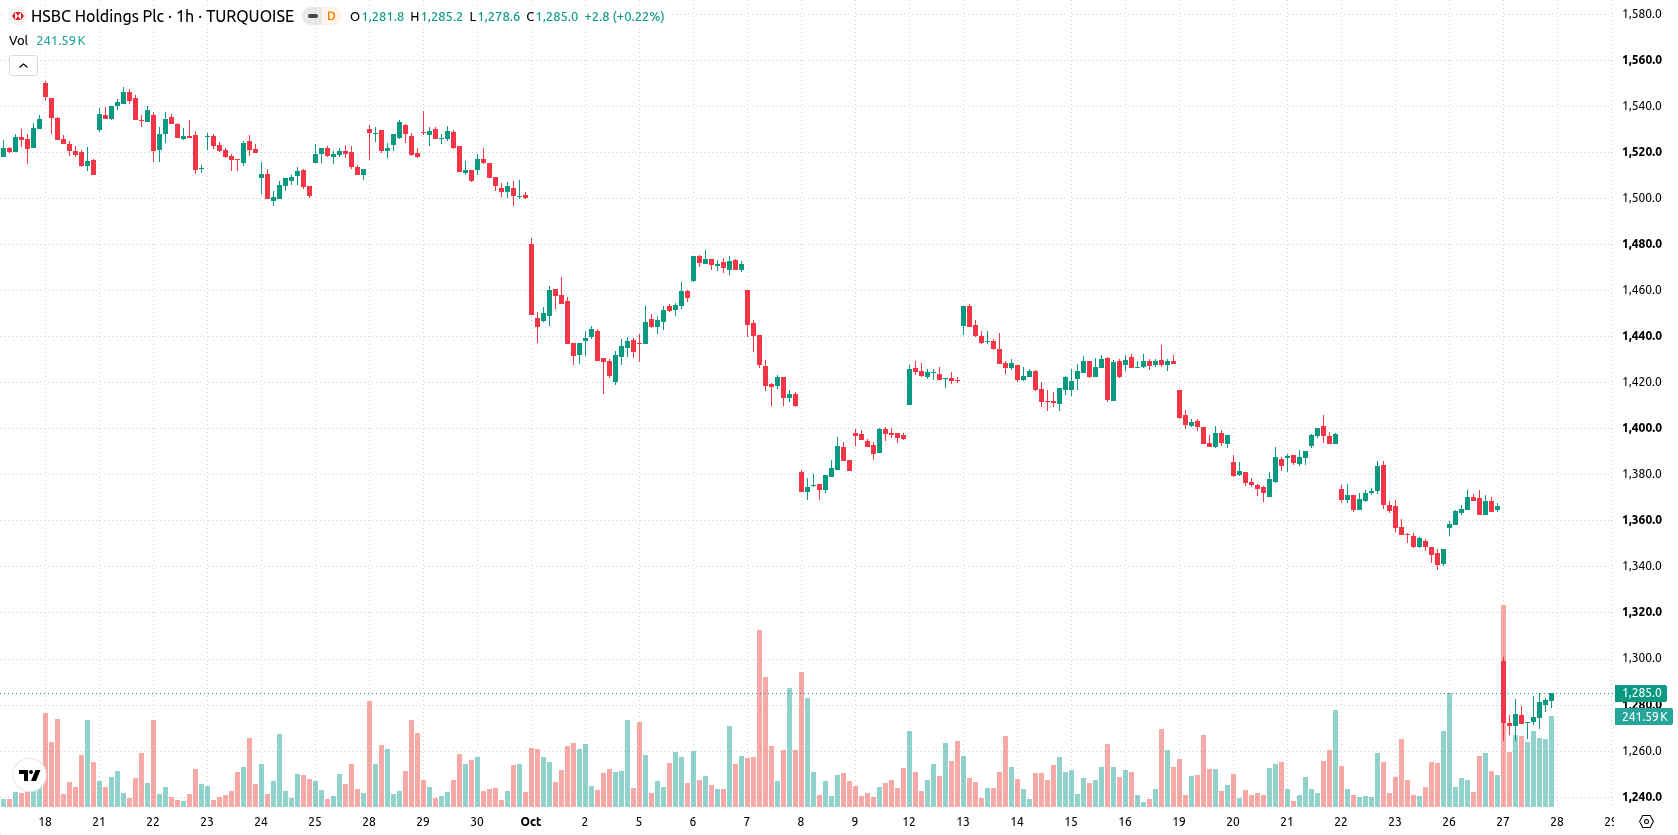
HSBC Holdings plc (HSBA) stock is trading at GBX1,285, marking a daily decline of 5.89%. The price currently sits below its key moving averages, reflecting continued downward momentum in the short and medium term.
 1292.40
1373.00
Highlights
- HSBC Holdings reported a 32% year-on-year increase in pre-tax profit for the third quarter of 2026, reaching $9.6 billion.
- The company approved a $1 billion share buyback and a third interim dividend of $0.10 per share, returning capital directly to shareholders.
- Shares of HSBC traded down 5.89% to GBX1,285 with broad technical indicators showing persistent bearish pressure and a projected range of GBX1,221 to GBX1,348.
Mixed sentiment as profit growth misses expectations despite buyback
HSBC Holdings reported its third-quarter 2026 results, posting a 32% year-on-year increase in pre-tax profit to $9.6 billion, though the figure fell slightly short of analyst expectations and contributed to a mixed market response. The company announced a share buyback program of up to $1 billion and approved a third interim dividend of $0.10 per share, initiatives that directly return capital to shareholders and provide theoretical support for the stock. Management also reaffirmed full-year guidance and a return on tangible equity target of 17% or higher, according to CNBC, indicating confidence in the bank’s ongoing profitability.
Multilevel resistance and negative momentum drive bearish setup
HSBA has fallen below the MA-20 at GBX1,322 as well as the MA-50 at GBX1,353, and now trades under the long-term MA-200 at GBX1,387. The Ichimoku Kijun at GBX1,318 represents the nearest technical resistance. The immediate support is at GBX1,221, while resistance stands at GBX1,318 and then GBX1,348. Momentum indicators are decisively negative, with MACD, ADX, and CCI all issuing sell signals, and RSI sitting at 31.61, indicating weak momentum. Stochastic RSI is neutral, Bull/Bear Power highlights selling dominance in intraday action, and the Awesome Oscillator is indecisive.
Further downside risk as volatility bands signal instability
Over the next several trading days, HSBA is expected to fluctuate between GBX1,221 and GBX1,348, which reflects the typical volatility band relative to current levels. There is a high probability (75%) of further declines, though a temporary stabilization within this range is the baseline expectation. Should the price break above the GBX1,318 Kijun resistance, there is potential for a short-term recovery. Conversely, a drop below GBX1,221 would indicate an extension of the current bearish trend.
In a recent review, analysts noted that weakness in banking stocks including HSBC, contributed to broader pressure on UK equities amid heightened caution around fiscal and external risks. The current technical setup for HSBC suggests the prevailing scenario remains bearish, with a break below GBX1,221 emerging as the key downside risk to monitor in the coming sessions.






Latest HSBC News





-
 Afghanistan
-
 Albania
-
 Algeria
-
 Angola
-
 Argentina
-
 Armenia
-
 Australia
-
 Austria
-
 Azerbaijan
-
 Bahamas
-
 Bahrain
-
 Bangladesh
-
 Belarus
-
 Belgium
-
 Bolivia
-
 Botswana
-
 Brazil
-
 Brunei
-
 Bulgaria
-
 Cambodia
-
 Cameroon
-
 Canada
-
 Chile
-
 China
-
 Colombia
-
 Congo
-
 Costa Rica
-
 Cote d'Ivoire
-
 Croatia
-
 Cuba
-
 Cyprus
-
 Czechia
-
 DR Congo
-
 Denmark
-
 Dominican Republic
-
 Ecuador
-
 Egypt
-
 El Salvador
-
 Estonia
-
 Eswatini
-
 Ethiopia
-
 Finland
-
 France
-
 Georgia
-
 Germany
-
 Ghana
-
 Greece
-
 Haiti
-
 Hong Kong
-
 Hungary
-
 India
-
 Indonesia
-
 Iran, Islamic republic
-
 Iraq
-
 Ireland
-
 Israel
-
 Italy
-
 Jamaica
-
 Japan
-
 Jordan
-
 Kazakhstan
-
 Kenya
-
 Korea
-
 Kuwait
-
 Kyrgyzstan
-
 Laos
-
 Latvia
-
 Lebanon
-
 Lesotho
-
 Libya
-
 Lithuania
-
 Luxembourg
-
 Madagascar
-
 Malaysia
-
 Malta
-
 Mauritius
-
 Mexico
-
 Moldova
-
 Mongolia
-
 Montenegro
-
 Morocco
-
 Mozambique
-
 Myanmar
-
 Namibia
-
 Nepal
-
 Netherlands
-
 New Zealand
-
 Nigeria
-
 North Macedonia
-
 Norway
-
 Oman
-
 Pakistan
-
 Palestine
-
 Panama
-
 Papua New Guinea
-
 Paraguay
-
 Peru
-
 Philippines
-
 Poland
-
 Portugal
-
 Puerto Rico
-
 Qatar
-
 Reunion
-
 Romania
-
 Rwanda
-
 Saudi Arabia
-
 Serbia
-
 Singapore
-
 Slovakia
-
 Slovenia
-
 Somalia
-
 South Africa
-
 Spain
-
 Sri Lanka
-
 Sweden
-
 Switzerland
-
 Syria
-
 Taiwan
-
 Tajikistan
-
 Tanzania
-
 Thailand
-
 Trinidad and Tobago
-
 Tunisia
-
 Turkey
-
 UAE
-
 Uganda
-
 Ukraine
-
 United Kingdom
-
United States
-
 Uruguay
-
 Uzbekistan
-
 Venezuela
-
 Vietnam
-
 Yemen
-
 Zambia
-
 Zimbabwe
- Forex
- Crypto












