

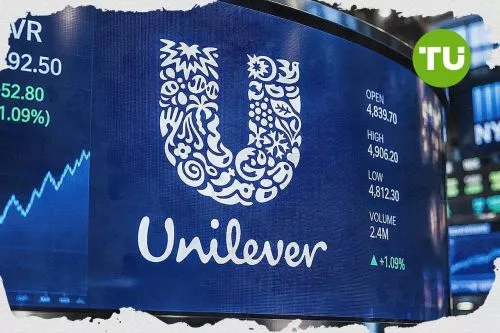
Unilever stock consolidates near buyer support as seller dominance persists intraday

Unilever (ULVR) stock is trading at GBX4,893, having slipped modestly lower on the day. The stock currently sits below its short- and medium-term moving averages, signaling some short-term softness relative to recent trends.
 4939.50
5068.00
Highlights
- Unilever posted 5.2% underlying sales growth and €13.3 billion turnover for Q3 2026, surpassing Q3 sales forecasts.
- Shareholder returns increased with a 3% quarterly dividend rise and completion of a €1.5 billion share buyback.
- Shares of Unilever trade below key short- and medium-term moving averages with technical indicators signaling prevailing downside pressure and a 4,770 to 5,016 GBX expected range.
Profitability gains and buyback as emerging markets drive sales beat
Unilever reported 5.2% underlying sales growth and €13.3 billion in turnover for Q3 2026, reflecting solid operational momentum and a resilient demand profile. The company further enhanced its capital return policy with a 3% increase in its quarterly dividend and the completion of a €1.5 billion share buyback, according to Advfn, actions that directly support shareholder returns through both income and reduced share float. Additional gains in profitability, highlighted by a 20.3% operating margin and efficiency achievements via an €800 million productivity program, reinforce the underlying business trend, while beating Q3 sales forecasts on strong emerging markets performance, as noted by Investing.com, adds further context to recent fundamental strength.
Seller momentum persists as negative technical signals dominate
On the H1 chart, ULVR is positioned below the MA-20 at GBX4,917 and the MA-50 at GBX4,905, with the daily timeframe showing support from the MA-200 at GBX4,646. The Ichimoku Kijun at GBX4,941 serves as immediate resistance. Momentum readings are largely negative — MACD and Awesome Oscillator both indicate a sell bias, while ADX remains neutral, not confirming a strong trend. RSI stands at 44.32 and, along with CCI and Stoch RSI, signals a leaning toward weakness but not outright oversold conditions. Bull/Bear Power indicates persistent seller dominance in the intraday session.
Sideways volatility expected as downside risk outweighs upside
Looking ahead to the next few sessions, price action in ULVR is expected to remain within the GBX4,770 to GBX5,016 range. There is a 42% probability of an upward move, with downside risk somewhat more likely at 58%. The base scenario calls for continued sideways trading within this volatility band. A clear breakout above the resistance at GBX4,941 may open a move toward the upper boundary, whereas a breakdown below GBX4,770 could prompt a push to fresh lows inside the defined corridor.
In a recent review, Unilever was highlighted for delivering stronger-than-expected sales growth driven by emerging markets, while maintaining its medium-term targets despite persistent input cost pressures. The latest technical signals point to continued sideways trading in a defined volatility band, making GBX4,941 a key resistance level that could determine the next directional move.










-
 Afghanistan
-
 Albania
-
 Algeria
-
 Angola
-
 Argentina
-
 Armenia
-
 Australia
-
 Austria
-
 Azerbaijan
-
 Bahamas
-
 Bahrain
-
 Bangladesh
-
 Belarus
-
 Belgium
-
 Bolivia
-
 Botswana
-
 Brazil
-
 Brunei
-
 Bulgaria
-
 Cambodia
-
 Cameroon
-
 Canada
-
 Chile
-
 China
-
 Colombia
-
 Congo
-
 Costa Rica
-
 Cote d'Ivoire
-
 Croatia
-
 Cuba
-
 Cyprus
-
 Czechia
-
 DR Congo
-
 Denmark
-
 Dominican Republic
-
 Ecuador
-
 Egypt
-
 El Salvador
-
 Estonia
-
 Eswatini
-
 Ethiopia
-
 Finland
-
 France
-
 Georgia
-
 Germany
-
 Ghana
-
 Greece
-
 Haiti
-
 Hong Kong
-
 Hungary
-
 India
-
 Indonesia
-
 Iran, Islamic republic
-
 Iraq
-
 Ireland
-
 Israel
-
 Italy
-
 Jamaica
-
 Japan
-
 Jordan
-
 Kazakhstan
-
 Kenya
-
 Korea
-
 Kuwait
-
 Kyrgyzstan
-
 Laos
-
 Latvia
-
 Lebanon
-
 Lesotho
-
 Libya
-
 Lithuania
-
 Luxembourg
-
 Madagascar
-
 Malaysia
-
 Malta
-
 Mauritius
-
 Mexico
-
 Moldova
-
 Mongolia
-
 Montenegro
-
 Morocco
-
 Mozambique
-
 Myanmar
-
 Namibia
-
 Nepal
-
 Netherlands
-
 New Zealand
-
 Nigeria
-
 North Macedonia
-
 Norway
-
 Oman
-
 Pakistan
-
 Palestine
-
 Panama
-
 Papua New Guinea
-
 Paraguay
-
 Peru
-
 Philippines
-
 Poland
-
 Portugal
-
 Puerto Rico
-
 Qatar
-
 Reunion
-
 Romania
-
 Rwanda
-
 Saudi Arabia
-
 Serbia
-
 Singapore
-
 Slovakia
-
 Slovenia
-
 Somalia
-
 South Africa
-
 Spain
-
 Sri Lanka
-
 Sweden
-
 Switzerland
-
 Syria
-
 Taiwan
-
 Tajikistan
-
 Tanzania
-
 Thailand
-
 Trinidad and Tobago
-
 Tunisia
-
 Turkey
-
 UAE
-
 Uganda
-
 Ukraine
-
 United Kingdom
-
United States
-
 Uruguay
-
 Uzbekistan
-
 Venezuela
-
 Vietnam
-
 Yemen
-
 Zambia
-
 Zimbabwe
- Forex
- Crypto












