

Suncor Energy shares technical analysis: Resistance test at C$109.5 as oversold RSI hints at reversal

Suncor Energy (SU) stock is trading at C$108.43, rising 1.32% in today's session. The price sits below its key short- and medium-term moving averages, but remains above its long-term trend levels.
 108.81
111.42
Highlights
- Suncor Energy stock is attracting short-term speculative trading ahead of its Q3 2026 earnings release on November 3.
- Investors seek clarity on operational performance and capital allocation, with expectations centered on potential new guidance or financial disclosures.
- Suncor Energy stock trades below key short-term averages with persistent negative momentum, staying within a C$105.88 to C$110.98 range over the next 2 to 3 days.
Speculative buying rises as Q3 earnings approach
Suncor Energy is drawing near-term market attention ahead of its scheduled Q3 2026 earnings release after the close on November 3, according to MarketBeat. Anticipation of potential new financial disclosures and guidance is likely driving speculative positioning, as investors look for insights into the company's operational performance and capital allocation. The earnings event creates a focal point for short-term positioning in SU, supporting today’s upward momentum.
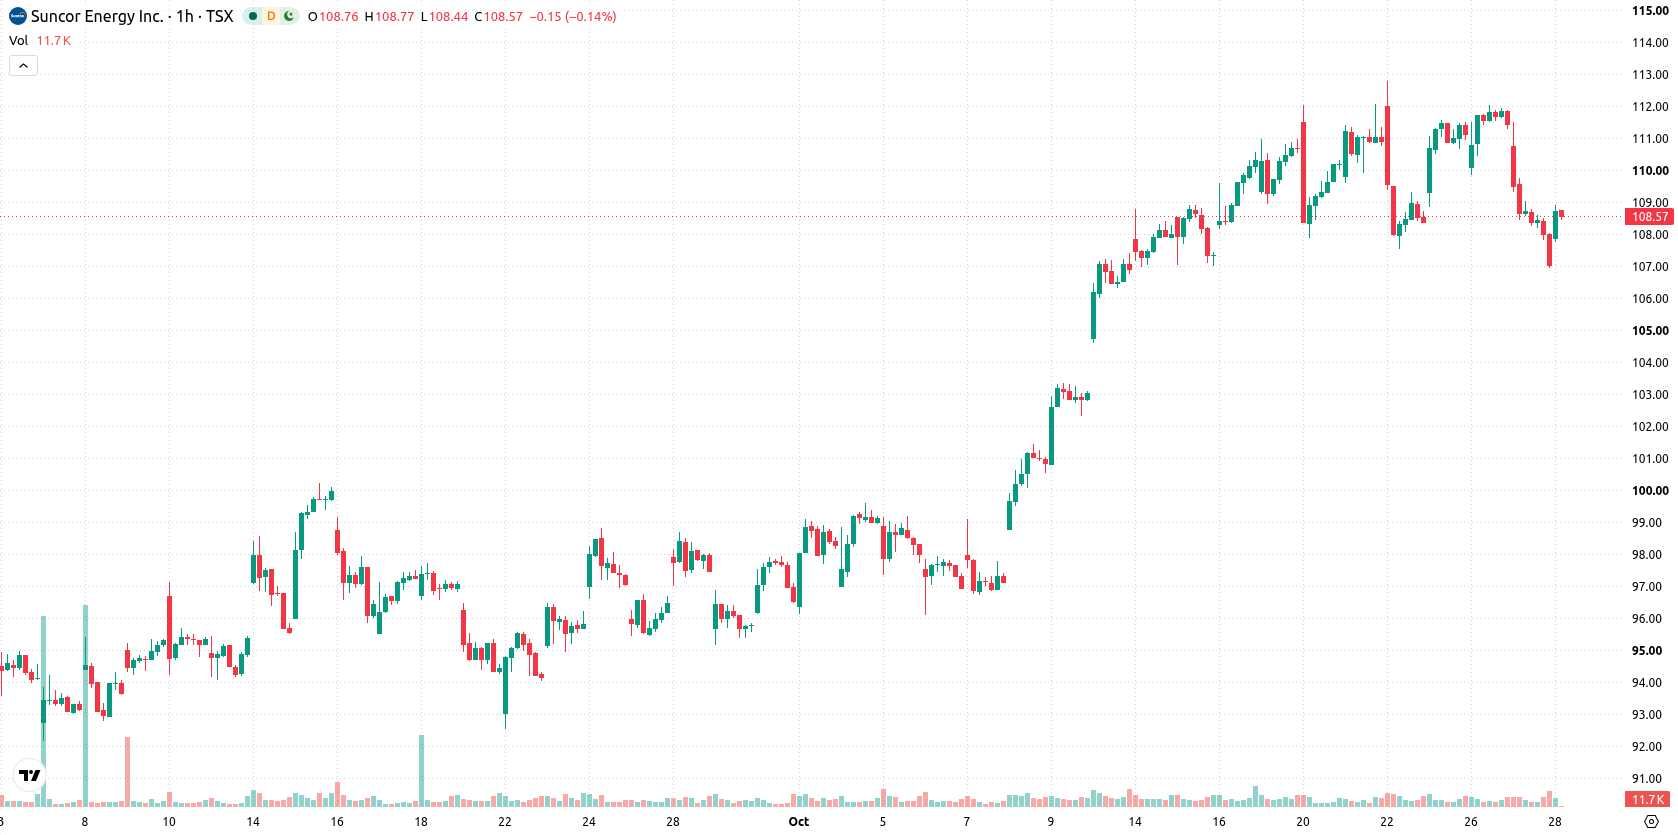
Short-term weakness persists despite long-term trend support
On the hourly chart, SU is currently below the MA-20 and MA-50, reflecting short- and medium-term selling pressure, yet remains above the MA-200, which acts as long-term support. The Ichimoku Kijun at C$109.5 serves as immediate resistance. Momentum is negative as indicated by both MACD and ADX, while RSI, Stochastic RSI, and CCI are all in oversold territory, suggesting downside exhaustion without a confirmed reversal. Bull/Bear Power continues to show seller dominance, and the Awesome Oscillator confirms the prevailing downtrend.
Volatility range holds as downside risk outweighs bullish potential
In the short term, SU is expected to oscillate within the C$105.88 to C$110.98 volatility band. The probability of a further decline stands at 54%, while the likelihood of an upward move is 46%. A bullish scenario would require a breakout above C$109.5 to trigger further buying, whereas a failure of support near C$105.88 could open up additional downside risk in the coming 2–3 trading days.
Earlier, analysts noted that Suncor Energy was displaying mixed technical momentum, with sideways price action prevailing ahead of upcoming earnings. The current analysis builds on this view by highlighting continued short-term weakness and clarifying that a decisive move above C$109.5 or below C$105.88 will determine the next directional trend.






Latest Suncor Energy News


-
 Afghanistan
-
 Albania
-
 Algeria
-
 Angola
-
 Argentina
-
 Armenia
-
 Australia
-
 Austria
-
 Azerbaijan
-
 Bahamas
-
 Bahrain
-
 Bangladesh
-
 Belarus
-
 Belgium
-
 Bolivia
-
 Botswana
-
 Brazil
-
 Brunei
-
 Bulgaria
-
 Cambodia
-
 Cameroon
-
 Canada
-
 Chile
-
 China
-
 Colombia
-
 Congo
-
 Costa Rica
-
 Cote d'Ivoire
-
 Croatia
-
 Cuba
-
 Cyprus
-
 Czechia
-
 DR Congo
-
 Denmark
-
 Dominican Republic
-
 Ecuador
-
 Egypt
-
 El Salvador
-
 Estonia
-
 Eswatini
-
 Ethiopia
-
 Finland
-
 France
-
 Georgia
-
 Germany
-
 Ghana
-
 Greece
-
 Haiti
-
 Hong Kong
-
 Hungary
-
 India
-
 Indonesia
-
 Iran, Islamic republic
-
 Iraq
-
 Ireland
-
 Israel
-
 Italy
-
 Jamaica
-
 Japan
-
 Jordan
-
 Kazakhstan
-
 Kenya
-
 Korea
-
 Kuwait
-
 Kyrgyzstan
-
 Laos
-
 Latvia
-
 Lebanon
-
 Lesotho
-
 Libya
-
 Lithuania
-
 Luxembourg
-
 Madagascar
-
 Malaysia
-
 Malta
-
 Mauritius
-
 Mexico
-
 Moldova
-
 Mongolia
-
 Montenegro
-
 Morocco
-
 Mozambique
-
 Myanmar
-
 Namibia
-
 Nepal
-
 Netherlands
-
 New Zealand
-
 Nigeria
-
 North Macedonia
-
 Norway
-
 Oman
-
 Pakistan
-
 Palestine
-
 Panama
-
 Papua New Guinea
-
 Paraguay
-
 Peru
-
 Philippines
-
 Poland
-
 Portugal
-
 Puerto Rico
-
 Qatar
-
 Reunion
-
 Romania
-
 Rwanda
-
 Saudi Arabia
-
 Serbia
-
 Singapore
-
 Slovakia
-
 Slovenia
-
 Somalia
-
 South Africa
-
 Spain
-
 Sri Lanka
-
 Sweden
-
 Switzerland
-
 Syria
-
 Taiwan
-
 Tajikistan
-
 Tanzania
-
 Thailand
-
 Trinidad and Tobago
-
 Tunisia
-
 Turkey
-
 UAE
-
 Uganda
-
 Ukraine
-
 United Kingdom
-
United States
-
 Uruguay
-
 Uzbekistan
-
 Venezuela
-
 Vietnam
-
 Yemen
-
 Zambia
-
 Zimbabwe
- Forex
- Crypto












