

Labcorp stock rallies as upward price move follows strong quarterly results and acquisition spree

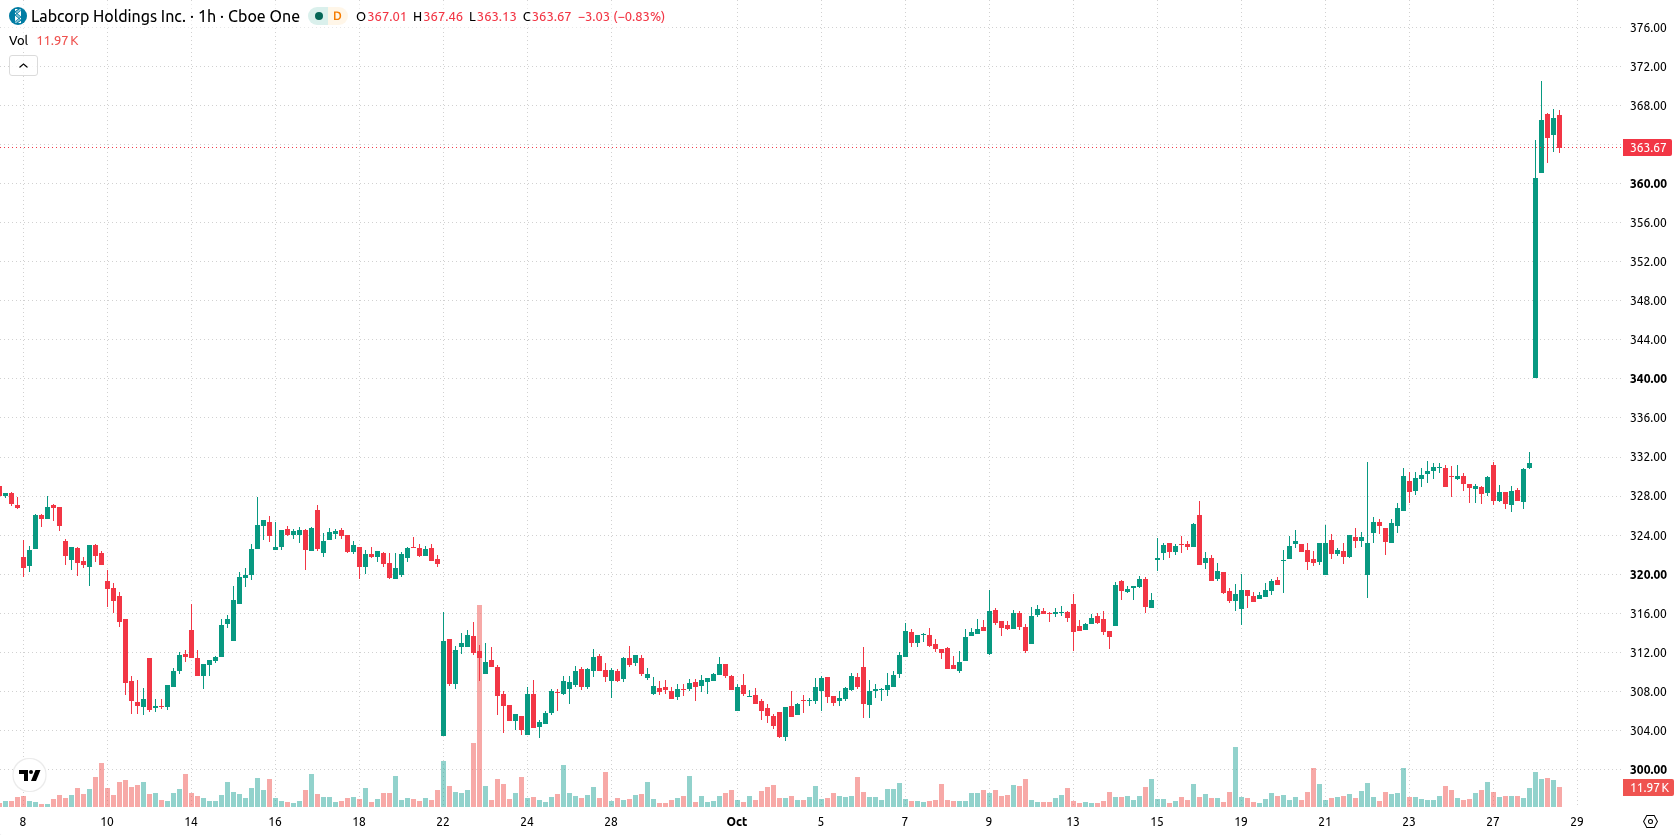
Labcorp (LH) stock is trading at $363.95, a daily gain of 9.9%. The price sits decisively above its key moving averages, underpinning robust short- and long-term momentum.
 368.91
370.54
Highlights
- Labcorp reported third-quarter 2026 revenue of $3.81 billion, an increase of 6.9% to 7% year-over-year, and raised full-year guidance for adjusted earnings per share and sales.
- The company announced four acquisitions, including assets from MLM Medical Labs and BioReference Health, and declared a $0.72 quarterly dividend with $255.5 million invested in acquisitions.
- Labcorp stock surged 9.9% to $363.95, with technical signals overbought and the expected trading range for the next 2 to 3 days at $357.31 to $402.74.
Investor demand rises as results, acquisitions, and guidance boost sentiment
Labcorp reported third-quarter 2026 revenue of $3.81 billion, representing a 6.9%-7% increase year-over-year, which signals continued strength in its core diagnostics and services business and drives increased investor demand, according to PR Newswire. Following these robust results, the company raised its full-year guidance for both adjusted earnings per share and sales, indicating management’s confidence in persistent revenue and margin momentum. The announcement of four acquisitions—including assets from MLM Medical Labs and BioReference Health—expands Labcorp’s footprint and diversifies future growth drivers. A $0.72 quarterly dividend declared and $255.5 million invested in acquisitions further highlight the company’s proactive capital allocation and income appeal.
Bullish bias intensifies as major averages and indicators align
On the H1 chart, LH is positioned above the MA-20, MA-50, and the long-term MA-200, reinforcing the prevailing uptrend. The Ichimoku Kijun level at $344.41 serves as immediate support. Momentum indicators remain favorable, with MACD and ADX both registering buy signals. RSI, Stochastic RSI, CCI, and Bull/Bear Power are all in overbought territory, while the Awesome Oscillator confirms the strong bullish momentum.
Consolidation expected with high upside odds and limited downside
Over the next 2–3 trading days, LH is likely to trade in a broad range between $357.31 and $402.74, forming a volatility band relative to current levels. The probability of an upward move is very high (over 80%), while downside risk is minimal. The baseline scenario anticipates price action to consolidate within this range; a breakout above resistance could trigger a further rally, while a breach of immediate support may prompt a short-term pullback.
Previously it was reported that Labcorp exhibited strong earnings-driven momentum, with analysts highlighting the potential for continued upside supported by technical strength. The current trading environment builds on this outlook, as expanding acquisitions and rising revenue reinforce an active uptrend, with the $344.41 Ichimoku Kijun serving as a critical support level for traders to monitor in the near term.






Latest Labcorp Holdings Inc News




-
 Afghanistan
-
 Albania
-
 Algeria
-
 Angola
-
 Argentina
-
 Armenia
-
 Australia
-
 Austria
-
 Azerbaijan
-
 Bahamas
-
 Bahrain
-
 Bangladesh
-
 Belarus
-
 Belgium
-
 Bolivia
-
 Botswana
-
 Brazil
-
 Brunei
-
 Bulgaria
-
 Cambodia
-
 Cameroon
-
 Canada
-
 Chile
-
 China
-
 Colombia
-
 Congo
-
 Costa Rica
-
 Cote d'Ivoire
-
 Croatia
-
 Cuba
-
 Cyprus
-
 Czechia
-
 DR Congo
-
 Denmark
-
 Dominican Republic
-
 Ecuador
-
 Egypt
-
 El Salvador
-
 Estonia
-
 Eswatini
-
 Ethiopia
-
 Finland
-
 France
-
 Georgia
-
 Germany
-
 Ghana
-
 Greece
-
 Haiti
-
 Hong Kong
-
 Hungary
-
 India
-
 Indonesia
-
 Iran, Islamic republic
-
 Iraq
-
 Ireland
-
 Israel
-
 Italy
-
 Jamaica
-
 Japan
-
 Jordan
-
 Kazakhstan
-
 Kenya
-
 Korea
-
 Kuwait
-
 Kyrgyzstan
-
 Laos
-
 Latvia
-
 Lebanon
-
 Lesotho
-
 Libya
-
 Lithuania
-
 Luxembourg
-
 Madagascar
-
 Malaysia
-
 Malta
-
 Mauritius
-
 Mexico
-
 Moldova
-
 Mongolia
-
 Montenegro
-
 Morocco
-
 Mozambique
-
 Myanmar
-
 Namibia
-
 Nepal
-
 Netherlands
-
 New Zealand
-
 Nigeria
-
 North Macedonia
-
 Norway
-
 Oman
-
 Pakistan
-
 Palestine
-
 Panama
-
 Papua New Guinea
-
 Paraguay
-
 Peru
-
 Philippines
-
 Poland
-
 Portugal
-
 Puerto Rico
-
 Qatar
-
 Reunion
-
 Romania
-
 Rwanda
-
 Saudi Arabia
-
 Serbia
-
 Singapore
-
 Slovakia
-
 Slovenia
-
 Somalia
-
 South Africa
-
 Spain
-
 Sri Lanka
-
 Sweden
-
 Switzerland
-
 Syria
-
 Taiwan
-
 Tajikistan
-
 Tanzania
-
 Thailand
-
 Trinidad and Tobago
-
 Tunisia
-
 Turkey
-
 UAE
-
 Uganda
-
 Ukraine
-
 United Kingdom
-
United States
-
 Uruguay
-
 Uzbekistan
-
 Venezuela
-
 Vietnam
-
 Yemen
-
 Zambia
-
 Zimbabwe
- Forex
- Crypto












