

NNDM slips as support pressure weighs on near-term outlook

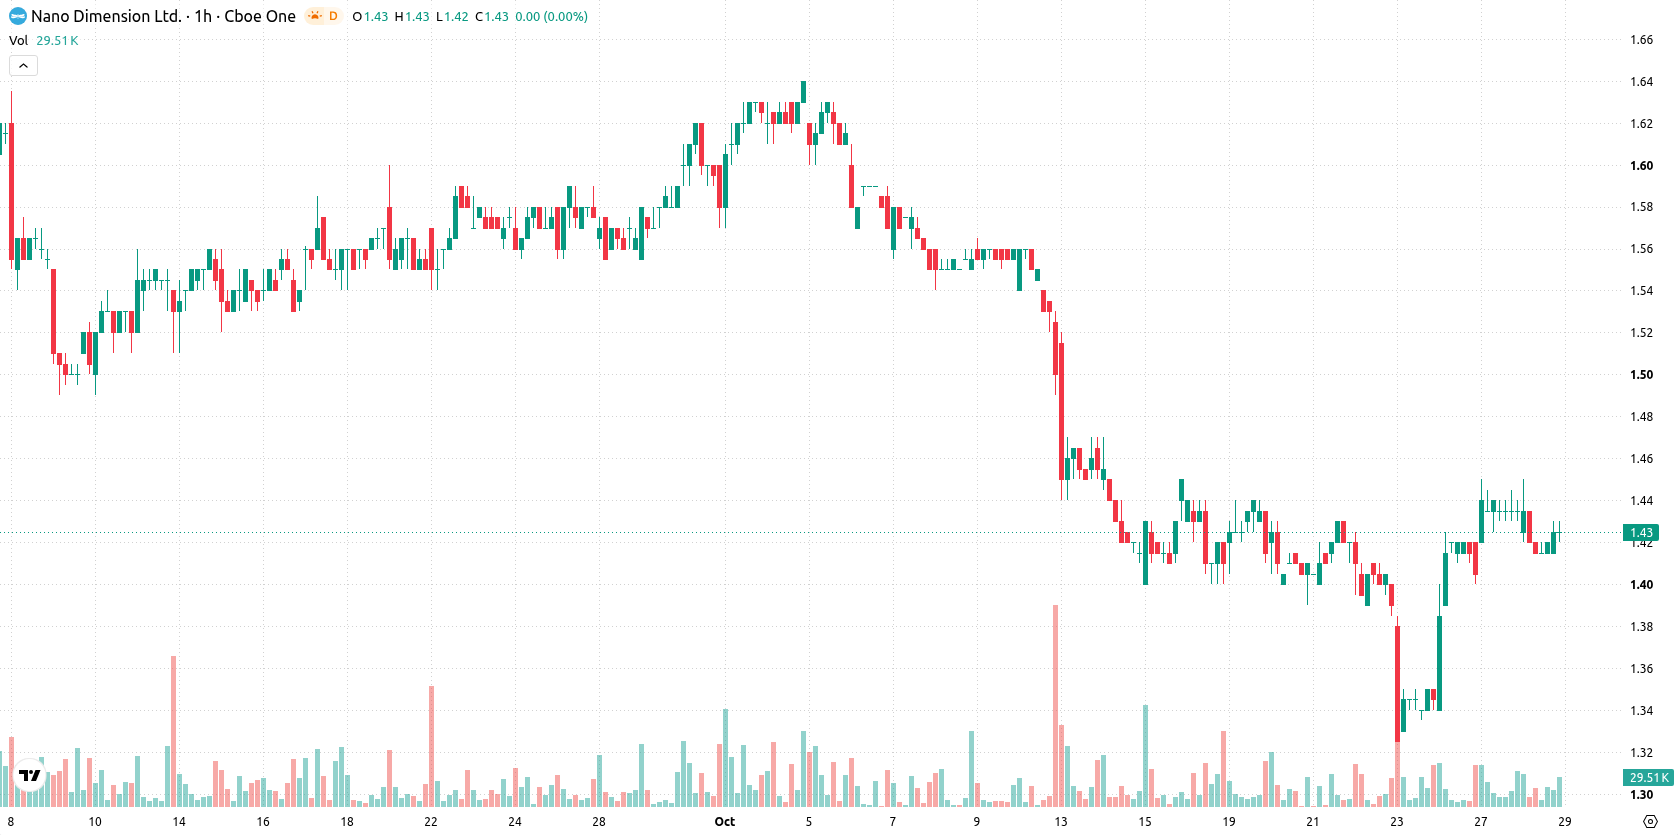
Nano Dimension (NNDM) stock is trading at $1.42, closing the session with a modest decline. The daily drop occurred as the price finished near its session low and currently sits below its key short- and long-term moving averages, with only medium-term support limiting further downside.
 1.39
1.45
Highlights
- NNDM/USD trades below key moving averages and closed at $1.42, down 1.05%, confirming a persistent bearish trend.
- Technical indicators show mixed momentum, with some suggesting buyer dominance intraday and others indicating indecision.
- Price is expected to move sideways between $1.36 and $1.48, with a 57% likelihood of further decline.
Mixed technical momentum as intraday buyer strength meets indicator conflict
On the technical side, NNDM is trading below the MA-20 and MA-200, while remaining slightly above the MA-50 on the hourly chart. The Ichimoku Kijun level at $1.40 serves as immediate support. For indicators, momentum signals are mixed: MACD displays a strong buy and ADX is in buy mode, indicating bullish momentum, yet oscillators differ, with RSI in buy territory, Stochastic RSI pointing to a sell, and CCI sitting neutral. Bull/Bear Power shows intraday buyer dominance, but the conflicting readings highlight indecisiveness in market sentiment.
Downside risk prevails amid probability-weighted range trade
In the short term, NNDM is expected to continue trading sideways within the $1.36 to $1.48 range based on typical volatility. There is a 43% probability of a breakout to the upside, but a 57% chance of a drop below immediate support, leaving the downside scenario as more likely. The baseline expectation is for the price to remain in its current range, unless a directional breakout occurs.
Earlier, analysts noted that Nano Dimension shares were largely confined to a range-bound pattern, with technical signals offering limited directional clarity. The latest session reinforces this sideways outlook, but with downside risks slightly elevated, traders should monitor any sustained move below immediate support levels for a potential shift in trend.










-
 Afghanistan
-
 Albania
-
 Algeria
-
 Angola
-
 Argentina
-
 Armenia
-
 Australia
-
 Austria
-
 Azerbaijan
-
 Bahamas
-
 Bahrain
-
 Bangladesh
-
 Belarus
-
 Belgium
-
 Bolivia
-
 Botswana
-
 Brazil
-
 Brunei
-
 Bulgaria
-
 Cambodia
-
 Cameroon
-
 Canada
-
 Chile
-
 China
-
 Colombia
-
 Congo
-
 Costa Rica
-
 Cote d'Ivoire
-
 Croatia
-
 Cuba
-
 Cyprus
-
 Czechia
-
 DR Congo
-
 Denmark
-
 Dominican Republic
-
 Ecuador
-
 Egypt
-
 El Salvador
-
 Estonia
-
 Eswatini
-
 Ethiopia
-
 Finland
-
 France
-
 Georgia
-
 Germany
-
 Ghana
-
 Greece
-
 Haiti
-
 Hong Kong
-
 Hungary
-
 India
-
 Indonesia
-
 Iran, Islamic republic
-
 Iraq
-
 Ireland
-
 Israel
-
 Italy
-
 Jamaica
-
 Japan
-
 Jordan
-
 Kazakhstan
-
 Kenya
-
 Korea
-
 Kuwait
-
 Kyrgyzstan
-
 Laos
-
 Latvia
-
 Lebanon
-
 Lesotho
-
 Libya
-
 Lithuania
-
 Luxembourg
-
 Madagascar
-
 Malaysia
-
 Malta
-
 Mauritius
-
 Mexico
-
 Moldova
-
 Mongolia
-
 Montenegro
-
 Morocco
-
 Mozambique
-
 Myanmar
-
 Namibia
-
 Nepal
-
 Netherlands
-
 New Zealand
-
 Nigeria
-
 North Macedonia
-
 Norway
-
 Oman
-
 Pakistan
-
 Palestine
-
 Panama
-
 Papua New Guinea
-
 Paraguay
-
 Peru
-
 Philippines
-
 Poland
-
 Portugal
-
 Puerto Rico
-
 Qatar
-
 Reunion
-
 Romania
-
 Rwanda
-
 Saudi Arabia
-
 Serbia
-
 Singapore
-
 Slovakia
-
 Slovenia
-
 Somalia
-
 South Africa
-
 Spain
-
 Sri Lanka
-
 Sweden
-
 Switzerland
-
 Syria
-
 Taiwan
-
 Tajikistan
-
 Tanzania
-
 Thailand
-
 Trinidad and Tobago
-
 Tunisia
-
 Turkey
-
 UAE
-
 Uganda
-
 Ukraine
-
 United Kingdom
-
United States
-
 Uruguay
-
 Uzbekistan
-
 Venezuela
-
 Vietnam
-
 Yemen
-
 Zambia
-
 Zimbabwe
- Forex
- Crypto












