


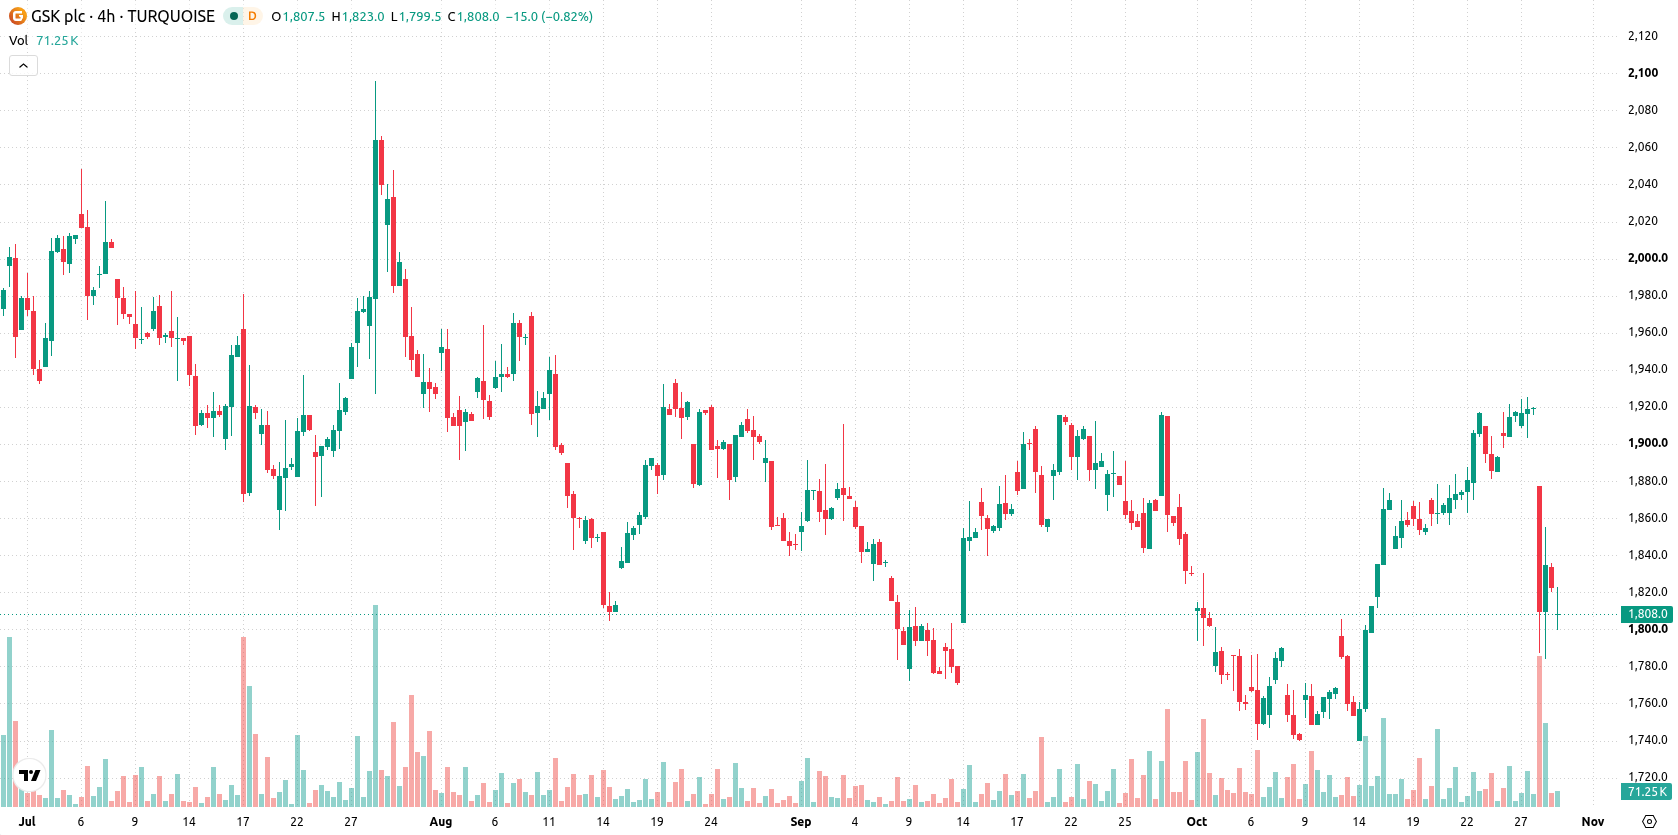
GSK plc (GSK) slid 1.5% after reporting third-quarter earnings including steady sales growth and reaffirmed full-year guidance, with sellers dominating early trade. The decline is supported by the stock remaining below its key 20-, 50-, and 200-day moving averages and encountering resistance near GBX1,832.
 1921.00
1944.00
Highlights
- GSK plc reported third-quarter 2026 sales growth of 5% at constant exchange rates to £8.9 billion, led by specialty medicines in respiratory disease and oncology.
- The company maintained its 2026 core earnings per share growth guidance at 7 to 9% and declared a third-quarter dividend of 17 pence per share.
- Shares of GSK traded below key moving averages with selling pressure and high probability of staying in the GBX1,732 to GBX1,875 range over five days.
Specialty medicines growth offsets vaccine slump amid persistent selling
GSK plc reported its third-quarter 2026 earnings, showing 5% sales growth at constant exchange rates to £8.9 billion, with specialty medicines driving performance through new launches in respiratory disease and oncology. Core earnings per share growth guidance for 2026 was maintained at 7–9%, and the company declared a third-quarter dividend of 17 pence per share, targeting 70 pence for the full year. Free cash flow rose by £1.8 billion year to date, supported by the out-licensing of linerixibat and a special dividend from changes in ViiV Healthcare shareholding, and vaccine sales declined 2% mainly due to a 24% drop in Arexvy. Twenty-two phase III trials remain on track for 2026, though price action has remained under broader selling pressure.
Mixed momentum and resistance challenge as technical signals diverge
GSK stock is trading below its 20-day (GBX1,826), 50-day (GBX1,849), and 200-day (GBX1,951) moving averages, confirming ongoing pressure from sellers across short-, medium-, and long-term horizons. The Ichimoku Kijun at GBX1,832 acts as resistance, with the price currently trading between the near-term floor at GBX1,790 and ceiling at GBX1,817. The longer-term trend bias remains bearish given the MA-50 vs MA-200 alignment. Momentum readings are mixed. MACD signals a buy and ADX is neutral, but the Relative Strength Index (RSI) at 47.25 generates a sell forecast, and Stochastic RSI at 38.03 points to strong sell conditions. The Commodity Channel Index (CCI) is neutral, and Bull/Bear Power (BBP) indicates buyers still dominate intraday momentum, yet its overbought warning suggests caution. Multiple oscillators and momentum indicators diverge, highlighting uncertainty as the session develops.
Earlier, analysts noted that GSK faced prevailing downside risks, with technical and fundamental signals highlighting bearish momentum. The latest price action reinforces this negative bias, and traders should watch for a convincing move above GBX1,832 resistance or a drop below the GBX1,790 floor as signals for the stock's next directional move.









-
 Afghanistan
-
 Albania
-
 Algeria
-
 Angola
-
 Argentina
-
 Armenia
-
 Australia
-
 Austria
-
 Azerbaijan
-
 Bahamas
-
 Bahrain
-
 Bangladesh
-
 Belarus
-
 Belgium
-
 Bolivia
-
 Botswana
-
 Brazil
-
 Brunei
-
 Bulgaria
-
 Cambodia
-
 Cameroon
-
 Canada
-
 Chile
-
 China
-
 Colombia
-
 Congo
-
 Costa Rica
-
 Cote d'Ivoire
-
 Croatia
-
 Cuba
-
 Cyprus
-
 Czechia
-
 DR Congo
-
 Denmark
-
 Dominican Republic
-
 Ecuador
-
 Egypt
-
 El Salvador
-
 Estonia
-
 Eswatini
-
 Ethiopia
-
 Finland
-
 France
-
 Georgia
-
 Germany
-
 Ghana
-
 Greece
-
 Haiti
-
 Hong Kong
-
 Hungary
-
 India
-
 Indonesia
-
 Iran, Islamic republic
-
 Iraq
-
 Ireland
-
 Israel
-
 Italy
-
 Jamaica
-
 Japan
-
 Jordan
-
 Kazakhstan
-
 Kenya
-
 Korea
-
 Kuwait
-
 Kyrgyzstan
-
 Laos
-
 Latvia
-
 Lebanon
-
 Lesotho
-
 Libya
-
 Lithuania
-
 Luxembourg
-
 Madagascar
-
 Malaysia
-
 Malta
-
 Mauritius
-
 Mexico
-
 Moldova
-
 Mongolia
-
 Montenegro
-
 Morocco
-
 Mozambique
-
 Myanmar
-
 Namibia
-
 Nepal
-
 Netherlands
-
 New Zealand
-
 Nigeria
-
 North Macedonia
-
 Norway
-
 Oman
-
 Pakistan
-
 Palestine
-
 Panama
-
 Papua New Guinea
-
 Paraguay
-
 Peru
-
 Philippines
-
 Poland
-
 Portugal
-
 Puerto Rico
-
 Qatar
-
 Reunion
-
 Romania
-
 Rwanda
-
 Saudi Arabia
-
 Serbia
-
 Singapore
-
 Slovakia
-
 Slovenia
-
 Somalia
-
 South Africa
-
 Spain
-
 Sri Lanka
-
 Sweden
-
 Switzerland
-
 Syria
-
 Taiwan
-
 Tajikistan
-
 Tanzania
-
 Thailand
-
 Trinidad and Tobago
-
 Tunisia
-
 Turkey
-
 UAE
-
 Uganda
-
 Ukraine
-
 United Kingdom
-
United States
-
 Uruguay
-
 Uzbekistan
-
 Venezuela
-
 Vietnam
-
 Yemen
-
 Zambia
-
 Zimbabwe
- Forex
- Crypto












