

Berkshire Hathaway stock weekly forecast: Choppy trend as divergence appears among momentum signals

Shares of Berkshire Hathaway Inc. (BRK.B) are trading near $540 as the stock holds its ground with buyers maintaining a firm grip. Steady performance and continued investor interest set the stage for another week where attention remains on earnings and corporate activity.
 556.20
Highlights
- Shares of Berkshire Hathaway edged slightly lower over the past week, currently trading at $540.6 near immediate resistance.
- The stock maintains a bullish long-term structure but short-term trend signals show mixed momentum with recent volatility at 1.7%.
- Expected trading range for the coming week is $536.48 to $544.71, with a 78% probability of price staying within this band.
Earnings outlook and tech investments boost sentiment despite net income risks
Berkshire is in focus this week as it prepares to report third-quarter 2026 earnings, with analyst consensus pointing to higher revenues but a potential dip in net income compared to the previous year, according to Yahoo Finance. The company’s robust financial flexibility is underpinned by a strong balance sheet, deep liquidity, and an ongoing commitment to tech investments and share repurchases, as highlighted by TradingView. Dividend income from major holdings such as Coca-Cola and American Express continues to provide strong cash returns far exceeding original purchase costs, The Motley Fool and The Economic Times note.
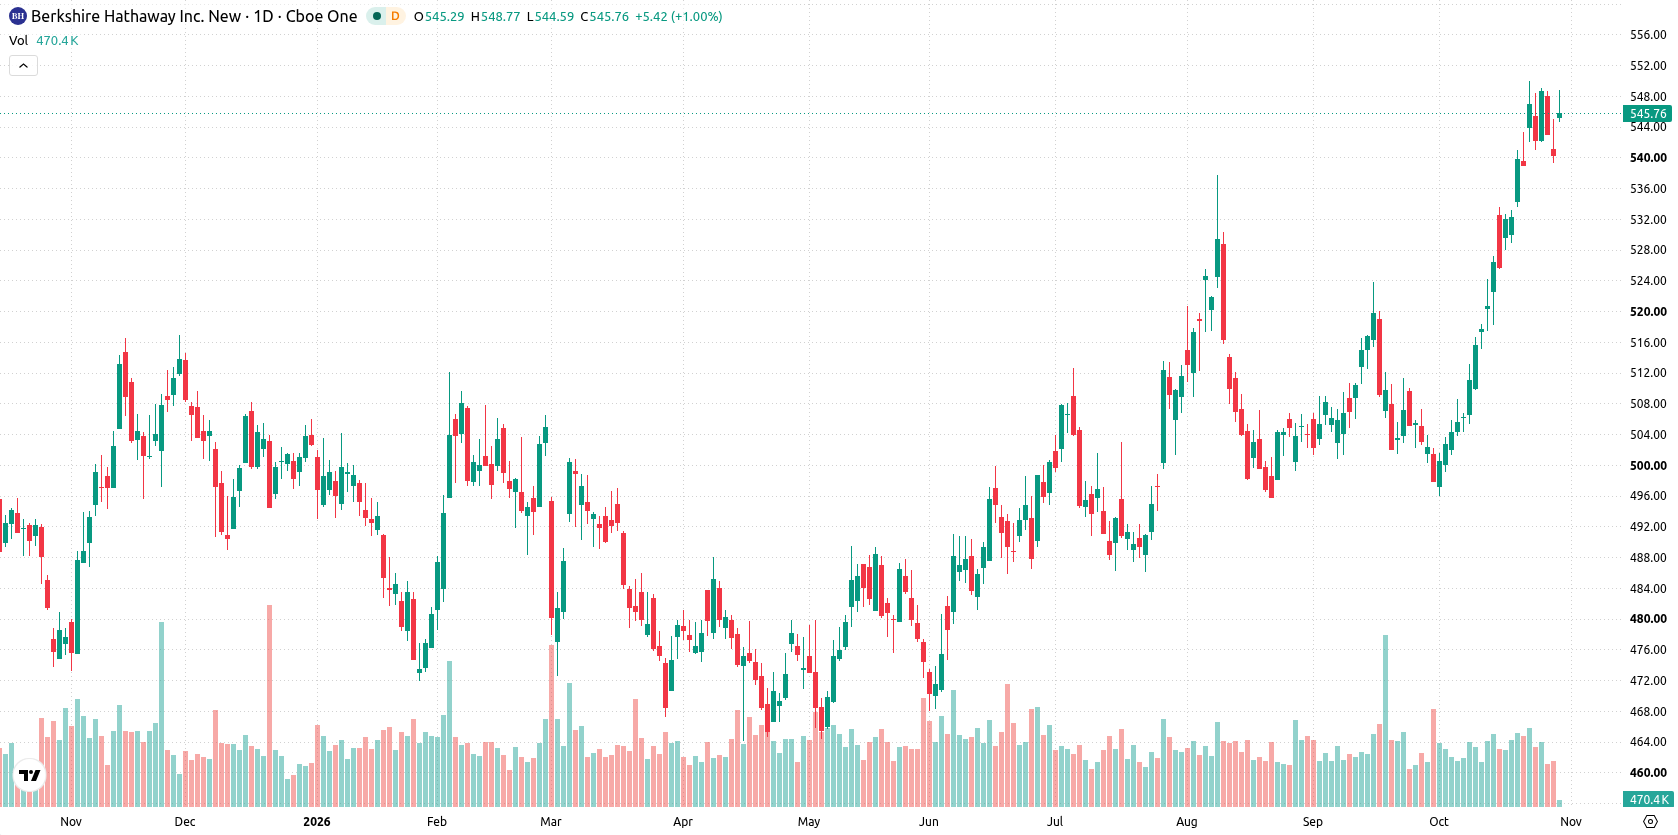
Momentum indicators diverge as technical resistance stalls weekly rally
The daily chart reveals trending conditions, with momentum characterized by a sustained move lower with a firm trend and volatility over the past week at 1.7%. The RSI reading at 66.28 is neutral, while the Stochastic RSI sits in its oversold zone, highlighting a divergence among momentum signals. MACD and ADX both point to underlying buy momentum, but the daily HMA issues a sell signal, suggesting the trend is facing near-term challenges. Immediate support rests at the MA-20 near $525.25, while price is currently pinned to near-term resistance at $540.73.
Bullish base case prevails as breakout risk centers on resistance
Over the coming trading week, the expected price range stands between $536.48 and $544.71. The probability of an increase is 78%, while the likelihood of a decrease is 22%. The base case calls for price action to stay within this range, with a push above $540.73 opening further upside potential. If shares fall beneath the support at $525.25, additional weakness could develop, while a move above immediate resistance may trigger fresh bullish momentum.
Previously it was reported that Berkshire Hathaway's expanding technology exposure and large cash reserves had reinforced its resilient uptrend despite signs of short-term exhaustion. The current setup adds a new dimension by highlighting divergent momentum signals and neutral RSI, making $540.73 a key level to watch for signs of sustained bullish momentum or emerging downside risk.











-
 Afghanistan
-
 Albania
-
 Algeria
-
 Angola
-
 Argentina
-
 Armenia
-
 Australia
-
 Austria
-
 Azerbaijan
-
 Bahamas
-
 Bahrain
-
 Bangladesh
-
 Belarus
-
 Belgium
-
 Bolivia
-
 Botswana
-
 Brazil
-
 Brunei
-
 Bulgaria
-
 Cambodia
-
 Cameroon
-
 Canada
-
 Chile
-
 China
-
 Colombia
-
 Congo
-
 Costa Rica
-
 Cote d'Ivoire
-
 Croatia
-
 Cuba
-
 Cyprus
-
 Czechia
-
 DR Congo
-
 Denmark
-
 Dominican Republic
-
 Ecuador
-
 Egypt
-
 El Salvador
-
 Estonia
-
 Eswatini
-
 Ethiopia
-
 Finland
-
 France
-
 Georgia
-
 Germany
-
 Ghana
-
 Greece
-
 Haiti
-
 Hong Kong
-
 Hungary
-
 India
-
 Indonesia
-
 Iran, Islamic republic
-
 Iraq
-
 Ireland
-
 Israel
-
 Italy
-
 Jamaica
-
 Japan
-
 Jordan
-
 Kazakhstan
-
 Kenya
-
 Korea
-
 Kuwait
-
 Kyrgyzstan
-
 Laos
-
 Latvia
-
 Lebanon
-
 Lesotho
-
 Libya
-
 Lithuania
-
 Luxembourg
-
 Madagascar
-
 Malaysia
-
 Malta
-
 Mauritius
-
 Mexico
-
 Moldova
-
 Mongolia
-
 Montenegro
-
 Morocco
-
 Mozambique
-
 Myanmar
-
 Namibia
-
 Nepal
-
 Netherlands
-
 New Zealand
-
 Nigeria
-
 North Macedonia
-
 Norway
-
 Oman
-
 Pakistan
-
 Palestine
-
 Panama
-
 Papua New Guinea
-
 Paraguay
-
 Peru
-
 Philippines
-
 Poland
-
 Portugal
-
 Puerto Rico
-
 Qatar
-
 Reunion
-
 Romania
-
 Rwanda
-
 Saudi Arabia
-
 Serbia
-
 Singapore
-
 Slovakia
-
 Slovenia
-
 Somalia
-
 South Africa
-
 Spain
-
 Sri Lanka
-
 Sweden
-
 Switzerland
-
 Syria
-
 Taiwan
-
 Tajikistan
-
 Tanzania
-
 Thailand
-
 Trinidad and Tobago
-
 Tunisia
-
 Turkey
-
 UAE
-
 Uganda
-
 Ukraine
-
 United Kingdom
-
United States
-
 Uruguay
-
 Uzbekistan
-
 Venezuela
-
 Vietnam
-
 Yemen
-
 Zambia
-
 Zimbabwe
- Forex
- Crypto












