

Microsoft reported strong quarterly results and major workforce buyouts: Will MSFT avoid deeper losses?

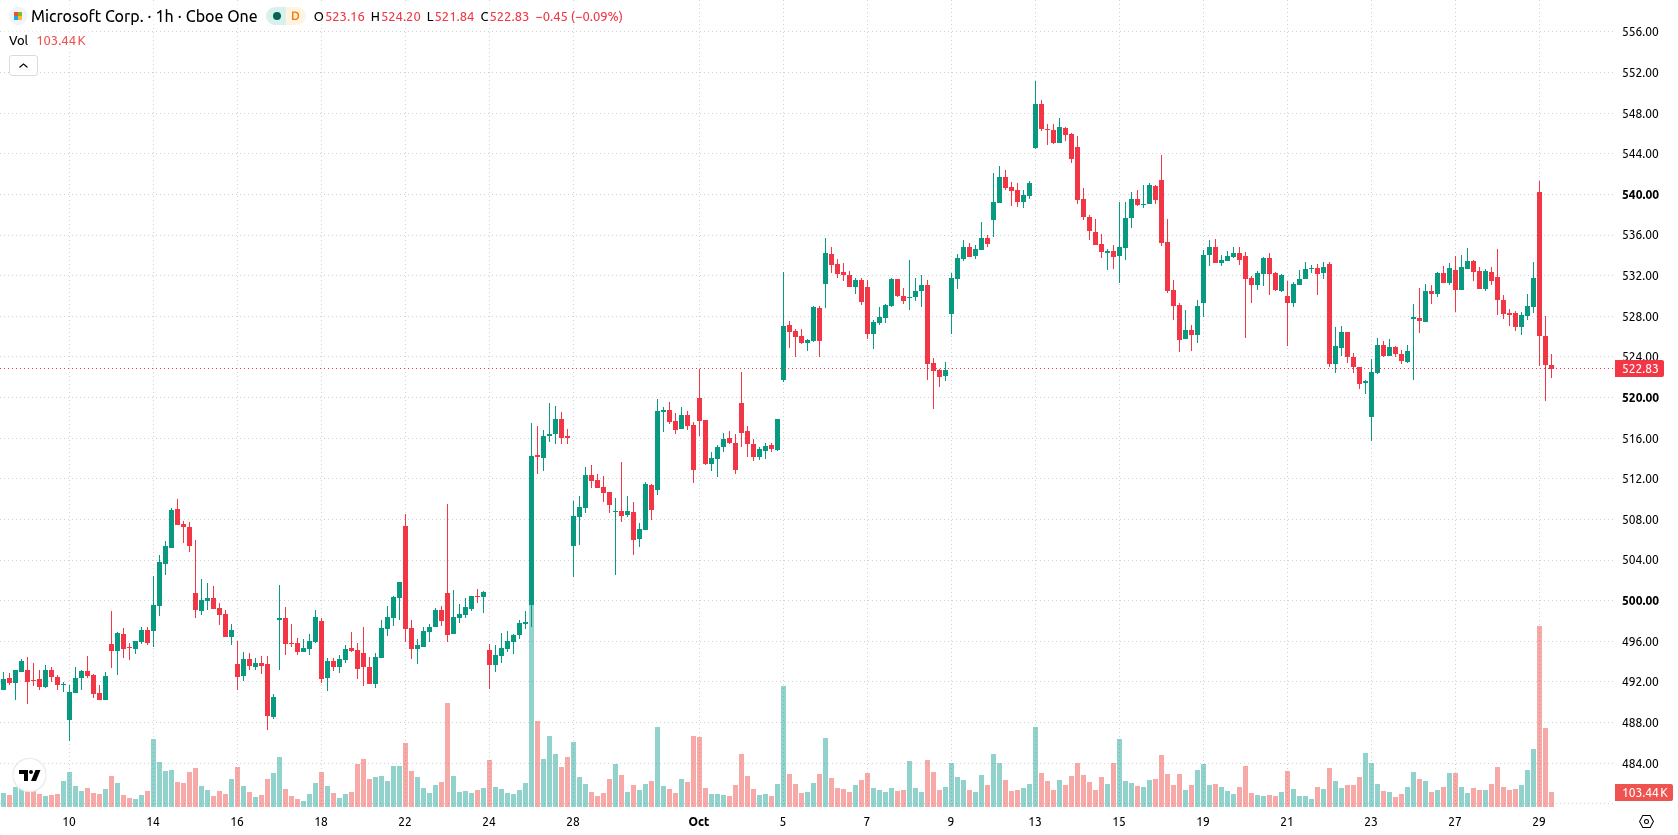
Microsoft (MSFT) stock is trading at $523.79, down 1.36% on the day. The price sits below its key short- and medium-term moving averages but remains above the long-term trend level.
 524.70
534.70
Highlights
- Microsoft reported revenue of $92.3 billion, up 19% year-over-year, with Azure cloud segment growth of 48% and net income at $36.6 billion.
- The company initiated buyouts affecting about a quarter of its workforce and increased capital expenditures to $45.2 billion to support AI and cloud investments.
- Shares of Microsoft closed at $523.79 after a 1.36% decline, with technical indicators showing short- and medium-term downside risk and an expected trading range of $515.29 to $535.7.
Cloud-fueled earnings and AI adoption boost outlook despite heavy investment
Microsoft reported strong quarterly results for the period ended September 30, 2026, as revenue rose 19% year-over-year to $92.3 billion and net income reached $36.6 billion, driven by 48% growth in the Azure cloud segment, according to News Microsoft. The company also initiated buyouts affecting roughly a quarter of its workforce, reallocating capital toward AI infrastructure, as reported by Theguardian. Capital expenditures for the quarter totaled $45.2 billion, and spending is set to increase further with continued investment in cloud and AI, according to CNBC. Usage of Microsoft's AI Copilot tool substantially increased over the quarter, reflecting strong adoption among enterprise customers, as noted by Gurufocus, though price action has remained under broader selling pressure.
Mixed overbought signals as price tests major technical resistance
MSFT is trading below its MA-20 at $532.08 and MA-50 at $529.55, but remains above the MA-200 at $437.28. The Ichimoku Kijun line at $542.85 marks the closest resistance. Momentum readings are mixed: RSI registers a high reading of 81.78, while Stoch RSI, CCI, and Bull/Bear Power highlight overbought conditions. At the same time, MACD and ADX point to ongoing buying strength, with Bull/Bear Power confirming strong buyer presence intraday and the Awesome Oscillator staying neutral.
Downside break favored as volatility dominates short-term trading range
In the short term, MSFT is expected to move within a typical volatility range of $515.29 to $535.7. The probability of an upward break is 30%, while a downside move is more likely at 70%. The base case scenario sees the stock trading sideways inside this range, with a bullish outcome triggered by a break above resistance at $542.85 and a bearish scenario unfolding if support near the lower end of the band fails.
Earlier, analysts noted that while Microsoft delivered stronger-than-expected earnings, ongoing heavy investment in AI infrastructure and broader sector caution were weighing on the shares. The current data add an important dimension by highlighting mixed momentum signals and an elevated likelihood of further downside volatility, suggesting traders should monitor the $515.29 support level closely for potential risk management.






Latest Microsoft News





-
 Afghanistan
-
 Albania
-
 Algeria
-
 Angola
-
 Argentina
-
 Armenia
-
 Australia
-
 Austria
-
 Azerbaijan
-
 Bahamas
-
 Bahrain
-
 Bangladesh
-
 Belarus
-
 Belgium
-
 Bolivia
-
 Botswana
-
 Brazil
-
 Brunei
-
 Bulgaria
-
 Cambodia
-
 Cameroon
-
 Canada
-
 Chile
-
 China
-
 Colombia
-
 Congo
-
 Costa Rica
-
 Cote d'Ivoire
-
 Croatia
-
 Cuba
-
 Cyprus
-
 Czechia
-
 DR Congo
-
 Denmark
-
 Dominican Republic
-
 Ecuador
-
 Egypt
-
 El Salvador
-
 Estonia
-
 Eswatini
-
 Ethiopia
-
 Finland
-
 France
-
 Georgia
-
 Germany
-
 Ghana
-
 Greece
-
 Haiti
-
 Hong Kong
-
 Hungary
-
 India
-
 Indonesia
-
 Iran, Islamic republic
-
 Iraq
-
 Ireland
-
 Israel
-
 Italy
-
 Jamaica
-
 Japan
-
 Jordan
-
 Kazakhstan
-
 Kenya
-
 Korea
-
 Kuwait
-
 Kyrgyzstan
-
 Laos
-
 Latvia
-
 Lebanon
-
 Lesotho
-
 Libya
-
 Lithuania
-
 Luxembourg
-
 Madagascar
-
 Malaysia
-
 Malta
-
 Mauritius
-
 Mexico
-
 Moldova
-
 Mongolia
-
 Montenegro
-
 Morocco
-
 Mozambique
-
 Myanmar
-
 Namibia
-
 Nepal
-
 Netherlands
-
 New Zealand
-
 Nigeria
-
 North Macedonia
-
 Norway
-
 Oman
-
 Pakistan
-
 Palestine
-
 Panama
-
 Papua New Guinea
-
 Paraguay
-
 Peru
-
 Philippines
-
 Poland
-
 Portugal
-
 Puerto Rico
-
 Qatar
-
 Reunion
-
 Romania
-
 Rwanda
-
 Saudi Arabia
-
 Serbia
-
 Singapore
-
 Slovakia
-
 Slovenia
-
 Somalia
-
 South Africa
-
 Spain
-
 Sri Lanka
-
 Sweden
-
 Switzerland
-
 Syria
-
 Taiwan
-
 Tajikistan
-
 Tanzania
-
 Thailand
-
 Trinidad and Tobago
-
 Tunisia
-
 Turkey
-
 UAE
-
 Uganda
-
 Ukraine
-
 United Kingdom
-
United States
-
 Uruguay
-
 Uzbekistan
-
 Venezuela
-
 Vietnam
-
 Yemen
-
 Zambia
-
 Zimbabwe
- Forex
- Crypto












