

Home Depot stock climbs as buyers dominate near-term price action

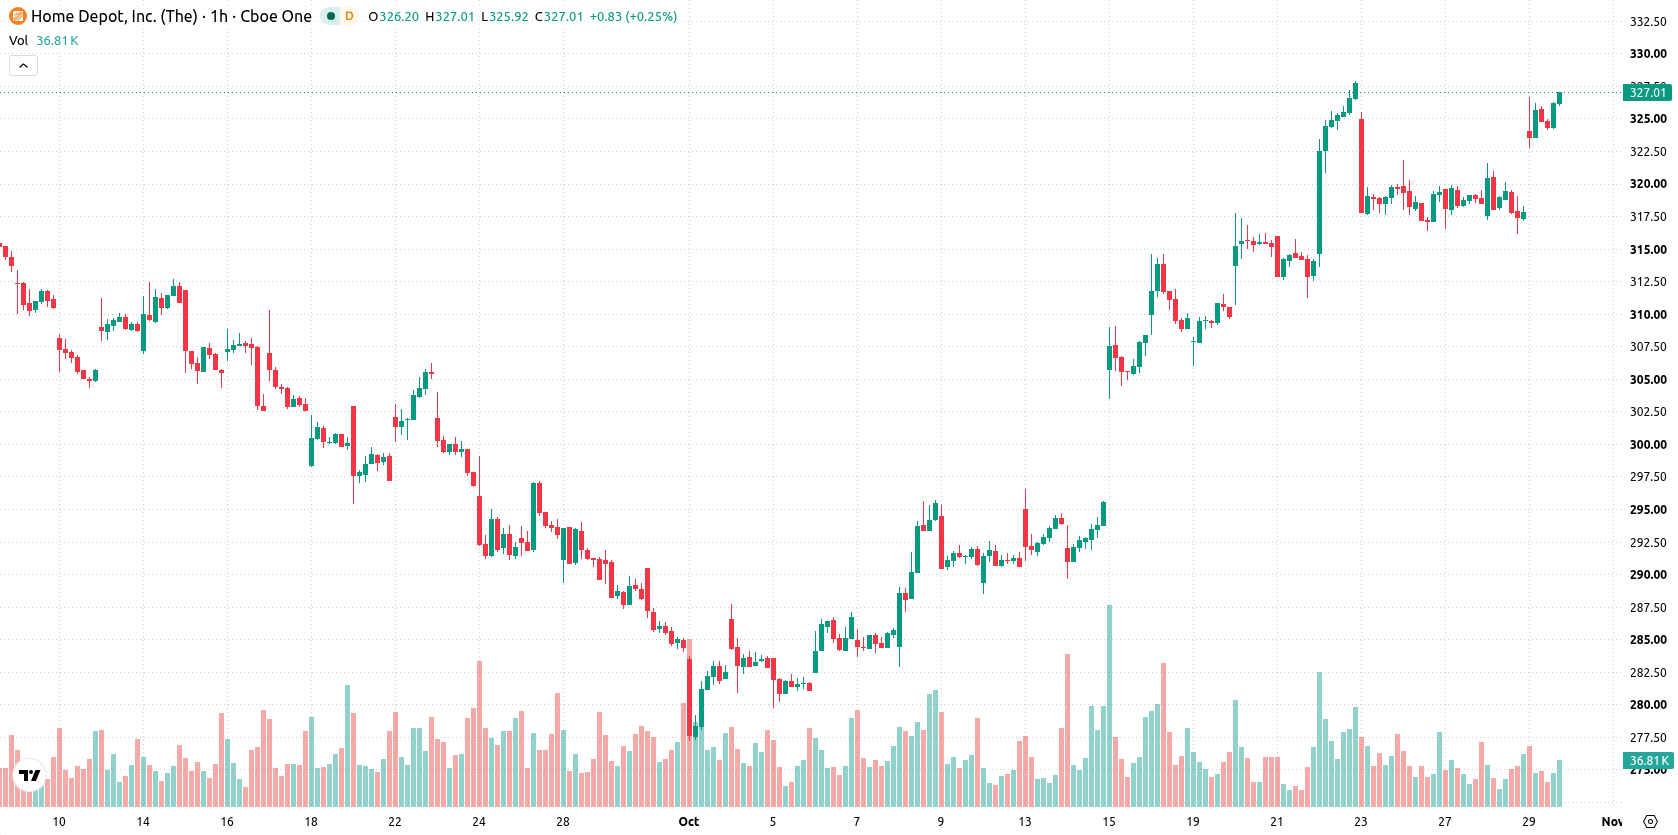
Home Depot (HD) stock is trading at $327.52, up 3.14% on the day. The price is currently positioned above its key short- and mid-term moving averages while remaining below levels tracked by longer-term trend gauges.
 349.34
356.88
Highlights
- Representative Pete Sessions sold between $1,001 and $15,000 of Home Depot stock on October 27, 2026.
- Such congressional sales of this size typically signal personal financial management rather than company-specific developments.
- Home Depot stock is trading in a strong short- and mid-term uptrend with overbought conditions, targeting a range of $323.4 to $333.56.
Muted price reaction as insider sale signals rebalancing, not weakness
A recent disclosure on October 27, 2026, revealed that Representative Pete Sessions (Republican-Texas) sold between $1,001 and $15,000 worth of Home Depot, Inc. stock via his E-Trade account, according to MarketBeat. While insider sales of this size can attract attention, they are often attributed to personal portfolio rebalancing or liquidity needs, offering only limited insight into underlying operational or valuation trends. As such, the direct impact on HD's price is likely muted, though the event provides incremental background to current trading flows.
Bullish bias as technical supports hold and overbought signals emerge
The price is holding above the MA-20 ($319.5) and MA-50 ($318.95), with both serving as support, while the MA-200 ($334.79) stands as the next significant resistance. The Ichimoku Kijun at $321.33 provides immediate support, and price remains just below the longer-term resistance area. Technical indicators show strong momentum, with MACD and ADX both signaling "Buy." RSI is elevated at 67.66, aligning with bullish conditions, but Stoch RSI, CCI, and Bull/Bear Power all indicate overbought territory, suggesting buyers are dominant in the near term. The Awesome Oscillator is currently neutral and does not confirm the uptrend, while price action hovers near today's high, reflecting strong intraday sentiment amid moderate volatility.
Potential breakout as high probability of gains meets defined risk
Looking ahead, HD is expected to trade within a range of $323.4 to $333.56 over the next several sessions. The probability of further gains is assessed as very high, with limited risk of a pullback unless price falls below the $321.33 support. Baseline expectations see consolidation within this corridor, while a breakout above $333.56 may trigger an extension toward higher targets. Alternatively, a drop below immediate support would raise the probability of a corrective move.
Earlier, analysts noted that Home Depot shares exhibited short- and medium-term technical strength while facing longer-term resistance. The current article adds a new dimension by incorporating recent insider sales but maintains a focus on the prevailing scenario, suggesting that the key level to watch remains the 200-day moving average as a potential inflection point for future price direction.









-
 Afghanistan
-
 Albania
-
 Algeria
-
 Angola
-
 Argentina
-
 Armenia
-
 Australia
-
 Austria
-
 Azerbaijan
-
 Bahamas
-
 Bahrain
-
 Bangladesh
-
 Belarus
-
 Belgium
-
 Bolivia
-
 Botswana
-
 Brazil
-
 Brunei
-
 Bulgaria
-
 Cambodia
-
 Cameroon
-
 Canada
-
 Chile
-
 China
-
 Colombia
-
 Congo
-
 Costa Rica
-
 Cote d'Ivoire
-
 Croatia
-
 Cuba
-
 Cyprus
-
 Czechia
-
 DR Congo
-
 Denmark
-
 Dominican Republic
-
 Ecuador
-
 Egypt
-
 El Salvador
-
 Estonia
-
 Eswatini
-
 Ethiopia
-
 Finland
-
 France
-
 Georgia
-
 Germany
-
 Ghana
-
 Greece
-
 Haiti
-
 Hong Kong
-
 Hungary
-
 India
-
 Indonesia
-
 Iran, Islamic republic
-
 Iraq
-
 Ireland
-
 Israel
-
 Italy
-
 Jamaica
-
 Japan
-
 Jordan
-
 Kazakhstan
-
 Kenya
-
 Korea
-
 Kuwait
-
 Kyrgyzstan
-
 Laos
-
 Latvia
-
 Lebanon
-
 Lesotho
-
 Libya
-
 Lithuania
-
 Luxembourg
-
 Madagascar
-
 Malaysia
-
 Malta
-
 Mauritius
-
 Mexico
-
 Moldova
-
 Mongolia
-
 Montenegro
-
 Morocco
-
 Mozambique
-
 Myanmar
-
 Namibia
-
 Nepal
-
 Netherlands
-
 New Zealand
-
 Nigeria
-
 North Macedonia
-
 Norway
-
 Oman
-
 Pakistan
-
 Palestine
-
 Panama
-
 Papua New Guinea
-
 Paraguay
-
 Peru
-
 Philippines
-
 Poland
-
 Portugal
-
 Puerto Rico
-
 Qatar
-
 Reunion
-
 Romania
-
 Rwanda
-
 Saudi Arabia
-
 Serbia
-
 Singapore
-
 Slovakia
-
 Slovenia
-
 Somalia
-
 South Africa
-
 Spain
-
 Sri Lanka
-
 Sweden
-
 Switzerland
-
 Syria
-
 Taiwan
-
 Tajikistan
-
 Tanzania
-
 Thailand
-
 Trinidad and Tobago
-
 Tunisia
-
 Turkey
-
 UAE
-
 Uganda
-
 Ukraine
-
 United Kingdom
-
United States
-
 Uruguay
-
 Uzbekistan
-
 Venezuela
-
 Vietnam
-
 Yemen
-
 Zambia
-
 Zimbabwe
- Forex
- Crypto












