


BT Group (BT-A) stock is trading at GBX213.4, posting a modest gain for the day. The price holds above its key short-, medium-, and long-term moving averages, indicating continued buyer support on shorter timeframes.
 215.20
Highlights
- BT Group acquired TalkTalk Telecommunications and PlatformX Communications, bringing immediate scale gain but projecting a £400 million cash impact in FY2027.
- The FY2026 dividend is 8.32p per share, offering a 3.9% yield and ongoing support for income-focused shareholders.
- Shares of BT Group are forecast to move between GBX210.31 to GBX216.49 over 2 to 3 days, with mixed momentum signals and strong but potentially exhausted buyer support.
Acquisition-driven expansion as cost pressures and dividend appeal persist
BT Group completed the acquisition of TalkTalk Telecommunications and PlatformX Communications from administration on October 5, 2026, securing services for around 2.5 million customers. This expansion immediately enlarges BT Group’s operating scale but brings an anticipated £400 million cash impact in FY2027 due to acquisition, transaction, and related costs. The company’s FY2026 dividend of 8.32p per share, delivering a 3.9% yield at recent prices, maintains support for shareholders and highlights the continued appeal of income distributions. Over the past five years, BT Group's share price has increased more than 50%, providing longer-term context for capital growth.
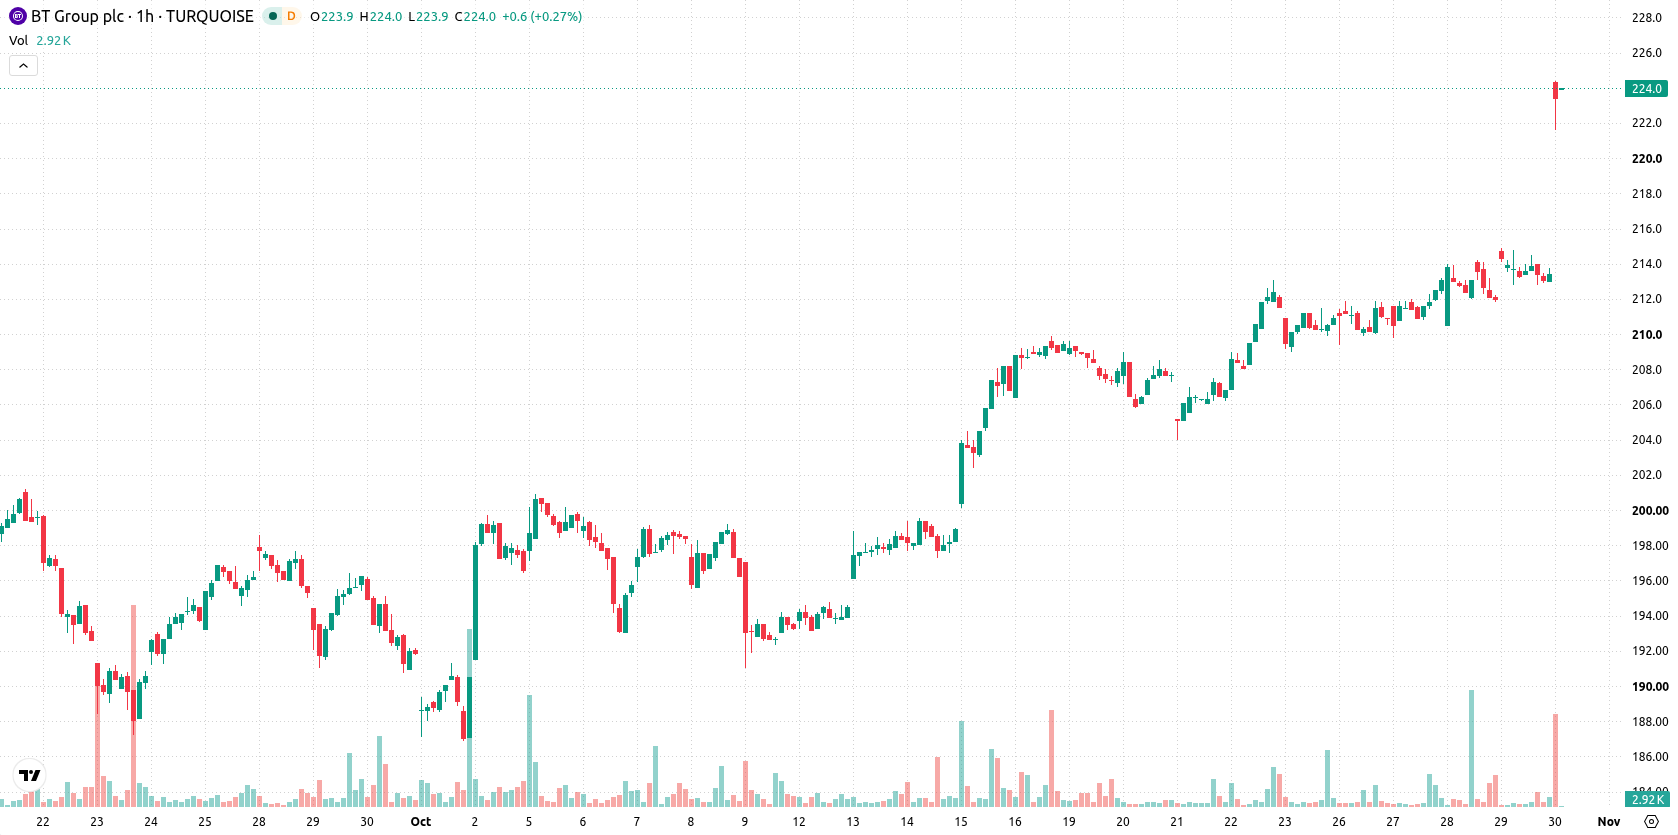
Bullish momentum faces caution as neutral signals emerge near overbought levels
Technically, the price is above the MA-20 (GBX213.15), MA-50 (GBX211.84), and well above the long-term MA-200 (GBX204.49) on the hourly chart. Immediate support sits at the Ichimoku Kijun level of GBX211.75. MACD signals a strong buy, and both RSI at 56.21 and Stochastic RSI are in positive territory, indicating buyers hold an advantage. However, ADX, CCI, and Awesome Oscillator all show neutral momentum, and Bull/Bear Power is in overbought territory—raising caution about potential near-term fatigue.
Range-bound trading likely as breakouts hinge on key support
In the short term, BT-A is expected to trade within a GBX210.31 to GBX216.49 volatility band relative to current levels over the next two to three sessions. The highest-probability scenario is for the price to remain range-bound inside this corridor. A break above resistance may open the way to test the upper boundary, while a close below the Kijun support at GBX211.75 could trigger a shift toward downside testing.
Earlier, analysts noted that BT Group was testing a major resistance zone amid potential sector partnerships, with the outlook sensitive to shifts in market momentum. The latest acquisition-driven expansion and current technical signals suggest traders should monitor the stability of the GBX211.75 support and the potential for a near-term breakout from the established volatility range.










-
 Afghanistan
-
 Albania
-
 Algeria
-
 Angola
-
 Argentina
-
 Armenia
-
 Australia
-
 Austria
-
 Azerbaijan
-
 Bahamas
-
 Bahrain
-
 Bangladesh
-
 Belarus
-
 Belgium
-
 Bolivia
-
 Botswana
-
 Brazil
-
 Brunei
-
 Bulgaria
-
 Cambodia
-
 Cameroon
-
 Canada
-
 Chile
-
 China
-
 Colombia
-
 Congo
-
 Costa Rica
-
 Cote d'Ivoire
-
 Croatia
-
 Cuba
-
 Cyprus
-
 Czechia
-
 DR Congo
-
 Denmark
-
 Dominican Republic
-
 Ecuador
-
 Egypt
-
 El Salvador
-
 Estonia
-
 Eswatini
-
 Ethiopia
-
 Finland
-
 France
-
 Georgia
-
 Germany
-
 Ghana
-
 Greece
-
 Haiti
-
 Hong Kong
-
 Hungary
-
 India
-
 Indonesia
-
 Iran, Islamic republic
-
 Iraq
-
 Ireland
-
 Israel
-
 Italy
-
 Jamaica
-
 Japan
-
 Jordan
-
 Kazakhstan
-
 Kenya
-
 Korea
-
 Kuwait
-
 Kyrgyzstan
-
 Laos
-
 Latvia
-
 Lebanon
-
 Lesotho
-
 Libya
-
 Lithuania
-
 Luxembourg
-
 Madagascar
-
 Malaysia
-
 Malta
-
 Mauritius
-
 Mexico
-
 Moldova
-
 Mongolia
-
 Montenegro
-
 Morocco
-
 Mozambique
-
 Myanmar
-
 Namibia
-
 Nepal
-
 Netherlands
-
 New Zealand
-
 Nigeria
-
 North Macedonia
-
 Norway
-
 Oman
-
 Pakistan
-
 Palestine
-
 Panama
-
 Papua New Guinea
-
 Paraguay
-
 Peru
-
 Philippines
-
 Poland
-
 Portugal
-
 Puerto Rico
-
 Qatar
-
 Reunion
-
 Romania
-
 Rwanda
-
 Saudi Arabia
-
 Serbia
-
 Singapore
-
 Slovakia
-
 Slovenia
-
 Somalia
-
 South Africa
-
 Spain
-
 Sri Lanka
-
 Sweden
-
 Switzerland
-
 Syria
-
 Taiwan
-
 Tajikistan
-
 Tanzania
-
 Thailand
-
 Trinidad and Tobago
-
 Tunisia
-
 Turkey
-
 UAE
-
 Uganda
-
 Ukraine
-
 United Kingdom
-
United States
-
 Uruguay
-
 Uzbekistan
-
 Venezuela
-
 Vietnam
-
 Yemen
-
 Zambia
-
 Zimbabwe
- Forex
- Crypto












