

BT Group stock consolidates as buyer support offsets weak momentum near GBX211.35 support

BT Group (BT-A) stock is trading at GBX212, showing a modest decline in the current session. The price sits just below its short-term average, but remains above medium and long-term moving averages.
 224.90
Highlights
- Shares of BT Group delivered a 21% total return including dividends over the past year.
- BT Group invested in fibre expansion, 5G build-out, and cost efficiency aimed at strengthening long-term competitiveness.
- BT Group stock faces short-term bearish pressure with medium- and long-term technical support, trading in a GBX208.82 to GBX215.18 range amid market indecision.
Investor returns rise as fibre and 5G investment shapes positioning
BT Group investors have realized a 21% total return including dividends over the past year, reflecting the company's concentrated effort on fibre rollout, 5G expansion, and cost transformation, according to Simplywall. These strategic initiatives highlight ongoing investment in network infrastructure and operational efficiency. The emphasis on capital allocation and technology upgrades supports longer-term competitiveness and may inform institutional positioning in the stock.
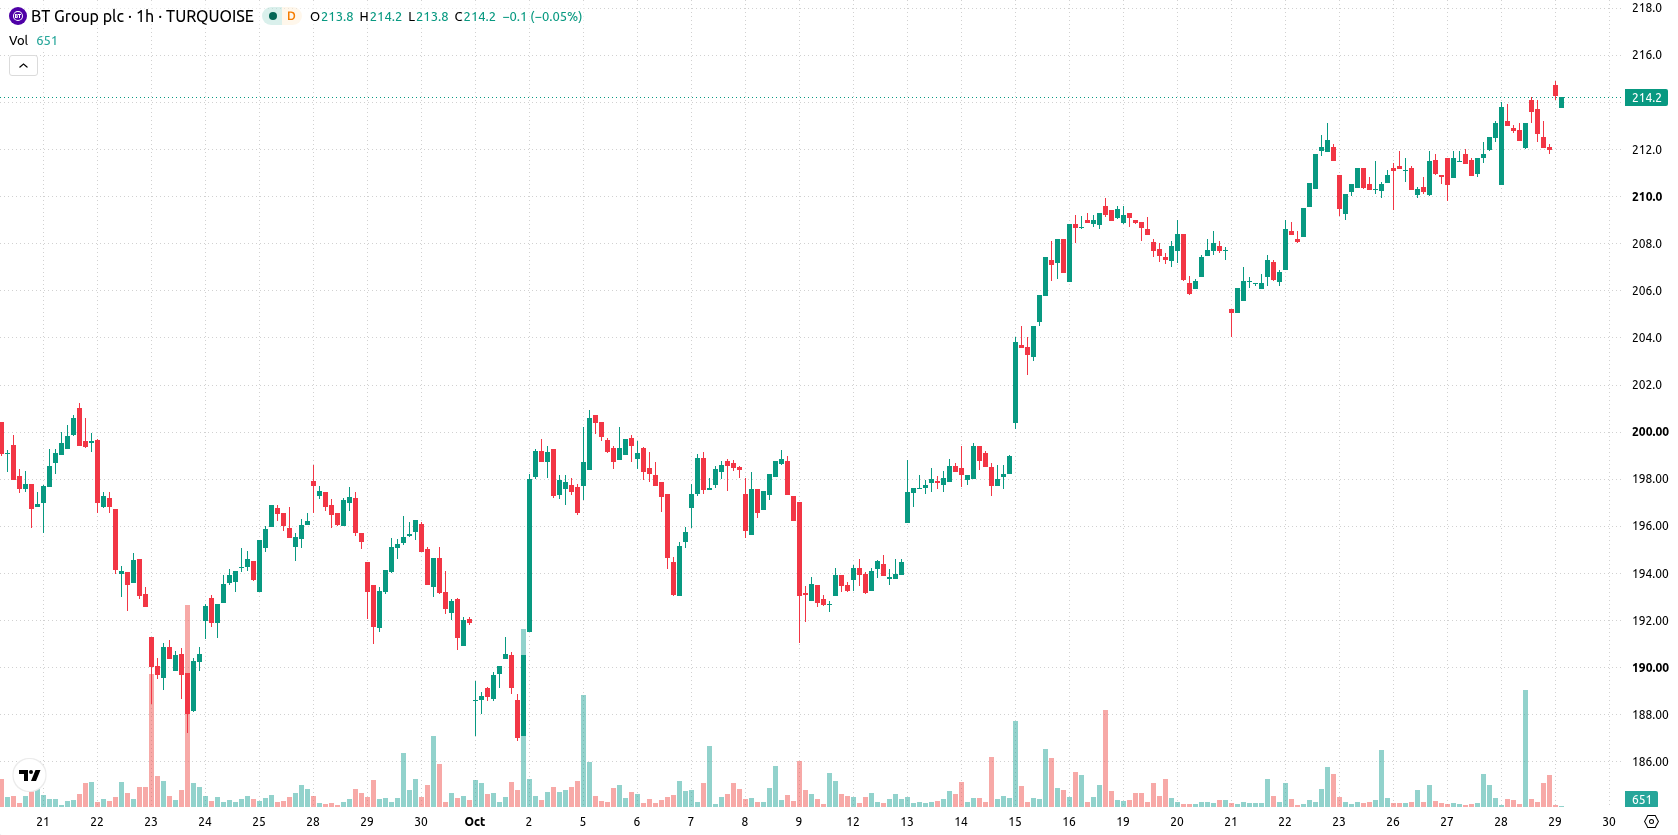
Mixed momentum as price hovers near short-term technical levels
BT-A/GBX is trading just below the MA-20 at GBX212.12, while remaining above both the MA-50 at GBX210.76 and the MA-200 at GBX204.34. The Ichimoku Kijun at GBX211.35 marks immediate support. On the momentum side, MACD signals strong buying while ADX points to selling. RSI is at 51.27, which shows a slight buy inclination. However, both Stoch RSI and Bull/Bear Power point to oversold conditions, CCI is neutral, and the Awesome Oscillator is also neutral, reflecting a mixed technical picture.
Upside probability increases within defined volatility corridor
Over the coming 2 to 3 sessions, BT-A/GBX is expected to fluctuate within a GBX208.82 to GBX215.18 volatility band. With a 58% probability skew towards the upside, an upward move is more likely than a downward one. The base scenario projects that the price will oscillate within this established corridor. A breakout above resistance could drive further gains, while a move below support would confirm near-term downside risk.
Earlier, analysts noted that BT Group's technical outlook was bolstered by strategic network upgrades and an improved security offering, positioning the stock on stable footing despite sector volatility. The current analysis adds dimension by highlighting a mixed momentum profile and a near-term trading range between GBX208.82 and GBX215.18, with a modest upside bias but the need to monitor for potential breakdown below immediate support.






Latest BT Group News



-
 Afghanistan
-
 Albania
-
 Algeria
-
 Angola
-
 Argentina
-
 Armenia
-
 Australia
-
 Austria
-
 Azerbaijan
-
 Bahamas
-
 Bahrain
-
 Bangladesh
-
 Belarus
-
 Belgium
-
 Bolivia
-
 Botswana
-
 Brazil
-
 Brunei
-
 Bulgaria
-
 Cambodia
-
 Cameroon
-
 Canada
-
 Chile
-
 China
-
 Colombia
-
 Congo
-
 Costa Rica
-
 Cote d'Ivoire
-
 Croatia
-
 Cuba
-
 Cyprus
-
 Czechia
-
 DR Congo
-
 Denmark
-
 Dominican Republic
-
 Ecuador
-
 Egypt
-
 El Salvador
-
 Estonia
-
 Eswatini
-
 Ethiopia
-
 Finland
-
 France
-
 Georgia
-
 Germany
-
 Ghana
-
 Greece
-
 Haiti
-
 Hong Kong
-
 Hungary
-
 India
-
 Indonesia
-
 Iran, Islamic republic
-
 Iraq
-
 Ireland
-
 Israel
-
 Italy
-
 Jamaica
-
 Japan
-
 Jordan
-
 Kazakhstan
-
 Kenya
-
 Korea
-
 Kuwait
-
 Kyrgyzstan
-
 Laos
-
 Latvia
-
 Lebanon
-
 Lesotho
-
 Libya
-
 Lithuania
-
 Luxembourg
-
 Madagascar
-
 Malaysia
-
 Malta
-
 Mauritius
-
 Mexico
-
 Moldova
-
 Mongolia
-
 Montenegro
-
 Morocco
-
 Mozambique
-
 Myanmar
-
 Namibia
-
 Nepal
-
 Netherlands
-
 New Zealand
-
 Nigeria
-
 North Macedonia
-
 Norway
-
 Oman
-
 Pakistan
-
 Palestine
-
 Panama
-
 Papua New Guinea
-
 Paraguay
-
 Peru
-
 Philippines
-
 Poland
-
 Portugal
-
 Puerto Rico
-
 Qatar
-
 Reunion
-
 Romania
-
 Rwanda
-
 Saudi Arabia
-
 Serbia
-
 Singapore
-
 Slovakia
-
 Slovenia
-
 Somalia
-
 South Africa
-
 Spain
-
 Sri Lanka
-
 Sweden
-
 Switzerland
-
 Syria
-
 Taiwan
-
 Tajikistan
-
 Tanzania
-
 Thailand
-
 Trinidad and Tobago
-
 Tunisia
-
 Turkey
-
 UAE
-
 Uganda
-
 Ukraine
-
 United Kingdom
-
United States
-
 Uruguay
-
 Uzbekistan
-
 Venezuela
-
 Vietnam
-
 Yemen
-
 Zambia
-
 Zimbabwe
- Forex
- Crypto












