

AAPL extends gains as buyer support boosts upward momentum

Apple Inc. (AAPL) stock is trading at $349.85, up 1.81% for the day and tracking above its key moving averages. The share price is currently positioned above both short- and medium-term trend measures as well as longer-term support zones.
 349.18
350.58
Highlights
- Apple stock set a new all-time closing high, supported by strong consumer demand for key products.
- The company introduced its first touchscreen MacBook Pro at $2,899, expanding the hardware lineup ahead of the upcoming fiscal fourth-quarter earnings report.
- Shares trade with bullish momentum above key moving averages, forecasted to remain in the $345.17 to $354.53 range with intraday overbought signals.
New closing high drives bullish flows amid strong demand signals
Apple reached a new all-time closing high on Nasdaq, a development highlighted by Macdailynews that underscores robust investor demand and increased trading momentum. Underpinning this move are continued signs of strong consumer interest, as Gurufocus reports the iPhone Duo’s waiting period has shortened amid sustained demand, supporting the company’s outlook for upcoming quarters. Additionally, the launch of Apple’s first touchscreen MacBook Pro at $2,899, according to Fool, further extends the hardware lineup and offers a fresh catalyst for both consumers and the market ahead of the scheduled fiscal fourth-quarter earnings release.
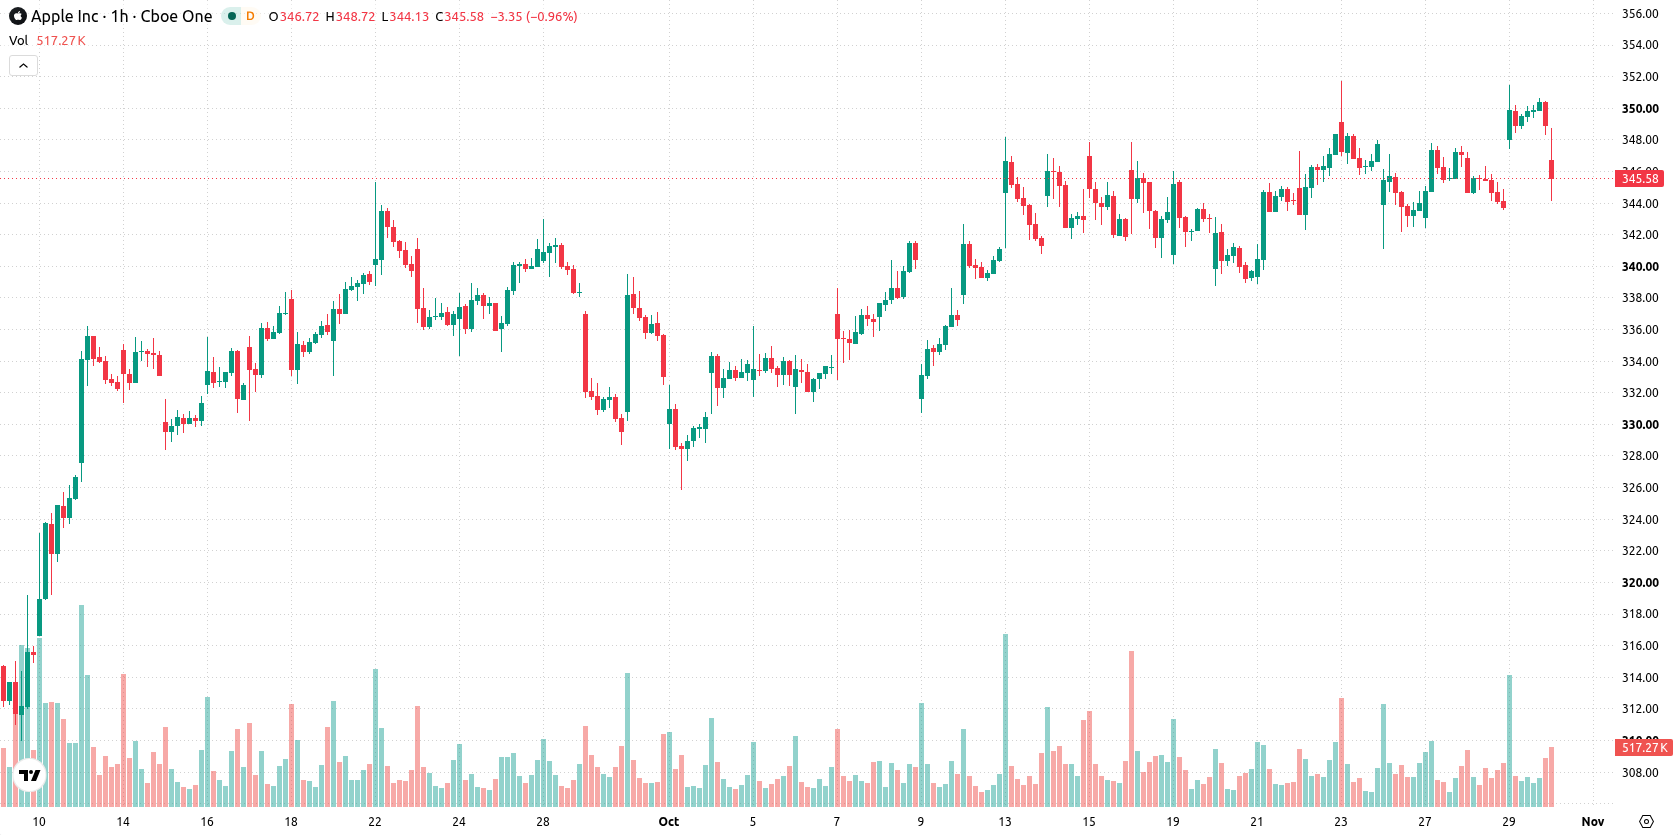
Overbought signals emerge as momentum maintains bullish advantage
AAPL is currently trading above its MA-20 at $347.04 and MA-50 at $346.09 on the H1 chart, and remains well above the MA-200 at $296.13 on the daily timeframe. Immediate support is defined by the Ichimoku Kijun at $347.22. Momentum indicators display strong buying: RSI stands at 62.07 (Buy), with both MACD and ADX confirming upward momentum, and Bull/Bear Power signaling continued buyer control. However, Stochastic RSI, CCI, and Bull/Bear Power are all in overbought territory, suggesting short-term technical stretch. The Awesome Oscillator also confirms the ongoing positive trend, with price currently sitting mid-range amid moderate volatility.
Upside favored as breakout risks rise on defined volatility band
Looking ahead over the next two to three trading days, AAPL is forecast to move within a range of $345.17 to $354.53 as the most probable scenario. Continued upside has a 74% likelihood, while a downward reversal has a lower probability. A decisive push above the upper boundary could unlock new highs, while a sustained breach below immediate support at the Kijun level may open the way to the lower end of the short-term volatility band.
Earlier, analysts noted that Apple shares were consolidating as regulatory developments and robust technical signals shaped a bullish near-term outlook. With the shares now establishing new all-time highs amid accelerating momentum and a broadened product lineup, a sustained move above $354.53 would reinforce the upward scenario while elevated technical readings highlight short-term risks around support at the Kijun level.











-
 Afghanistan
-
 Albania
-
 Algeria
-
 Angola
-
 Argentina
-
 Armenia
-
 Australia
-
 Austria
-
 Azerbaijan
-
 Bahamas
-
 Bahrain
-
 Bangladesh
-
 Belarus
-
 Belgium
-
 Bolivia
-
 Botswana
-
 Brazil
-
 Brunei
-
 Bulgaria
-
 Cambodia
-
 Cameroon
-
 Canada
-
 Chile
-
 China
-
 Colombia
-
 Congo
-
 Costa Rica
-
 Cote d'Ivoire
-
 Croatia
-
 Cuba
-
 Cyprus
-
 Czechia
-
 DR Congo
-
 Denmark
-
 Dominican Republic
-
 Ecuador
-
 Egypt
-
 El Salvador
-
 Estonia
-
 Eswatini
-
 Ethiopia
-
 Finland
-
 France
-
 Georgia
-
 Germany
-
 Ghana
-
 Greece
-
 Haiti
-
 Hong Kong
-
 Hungary
-
 India
-
 Indonesia
-
 Iran, Islamic republic
-
 Iraq
-
 Ireland
-
 Israel
-
 Italy
-
 Jamaica
-
 Japan
-
 Jordan
-
 Kazakhstan
-
 Kenya
-
 Korea
-
 Kuwait
-
 Kyrgyzstan
-
 Laos
-
 Latvia
-
 Lebanon
-
 Lesotho
-
 Libya
-
 Lithuania
-
 Luxembourg
-
 Madagascar
-
 Malaysia
-
 Malta
-
 Mauritius
-
 Mexico
-
 Moldova
-
 Mongolia
-
 Montenegro
-
 Morocco
-
 Mozambique
-
 Myanmar
-
 Namibia
-
 Nepal
-
 Netherlands
-
 New Zealand
-
 Nigeria
-
 North Macedonia
-
 Norway
-
 Oman
-
 Pakistan
-
 Palestine
-
 Panama
-
 Papua New Guinea
-
 Paraguay
-
 Peru
-
 Philippines
-
 Poland
-
 Portugal
-
 Puerto Rico
-
 Qatar
-
 Reunion
-
 Romania
-
 Rwanda
-
 Saudi Arabia
-
 Serbia
-
 Singapore
-
 Slovakia
-
 Slovenia
-
 Somalia
-
 South Africa
-
 Spain
-
 Sri Lanka
-
 Sweden
-
 Switzerland
-
 Syria
-
 Taiwan
-
 Tajikistan
-
 Tanzania
-
 Thailand
-
 Trinidad and Tobago
-
 Tunisia
-
 Turkey
-
 UAE
-
 Uganda
-
 Ukraine
-
 United Kingdom
-
United States
-
 Uruguay
-
 Uzbekistan
-
 Venezuela
-
 Vietnam
-
 Yemen
-
 Zambia
-
 Zimbabwe
- Forex
- Crypto












