


Suncor Energy Inc. (SU) advanced 2.03% after anticipation grew ahead of its upcoming third-quarter 2026 financial results and analyst call. The move is supported by the stock trading above its major moving averages and maintaining a bullish technical structure.
 111.21
112.03
Highlights
- Suncor Energy will release third-quarter 2026 results on November 3, with an analyst call set for November 4.
- Investor and trader focus is high ahead of the upcoming earnings event for Suncor Energy stock.
- Suncor Energy stock is in a strong bullish trend, trading above key averages with a five-day forecast range of C$108.31 to C$113.39.
Investor flows intensify ahead of third-quarter results and call
Suncor Energy is drawing investor attention as it prepares to release its third-quarter 2026 results on November 3. The company will also hold its analyst call on November 4. The upcoming earnings event is in focus for traders.
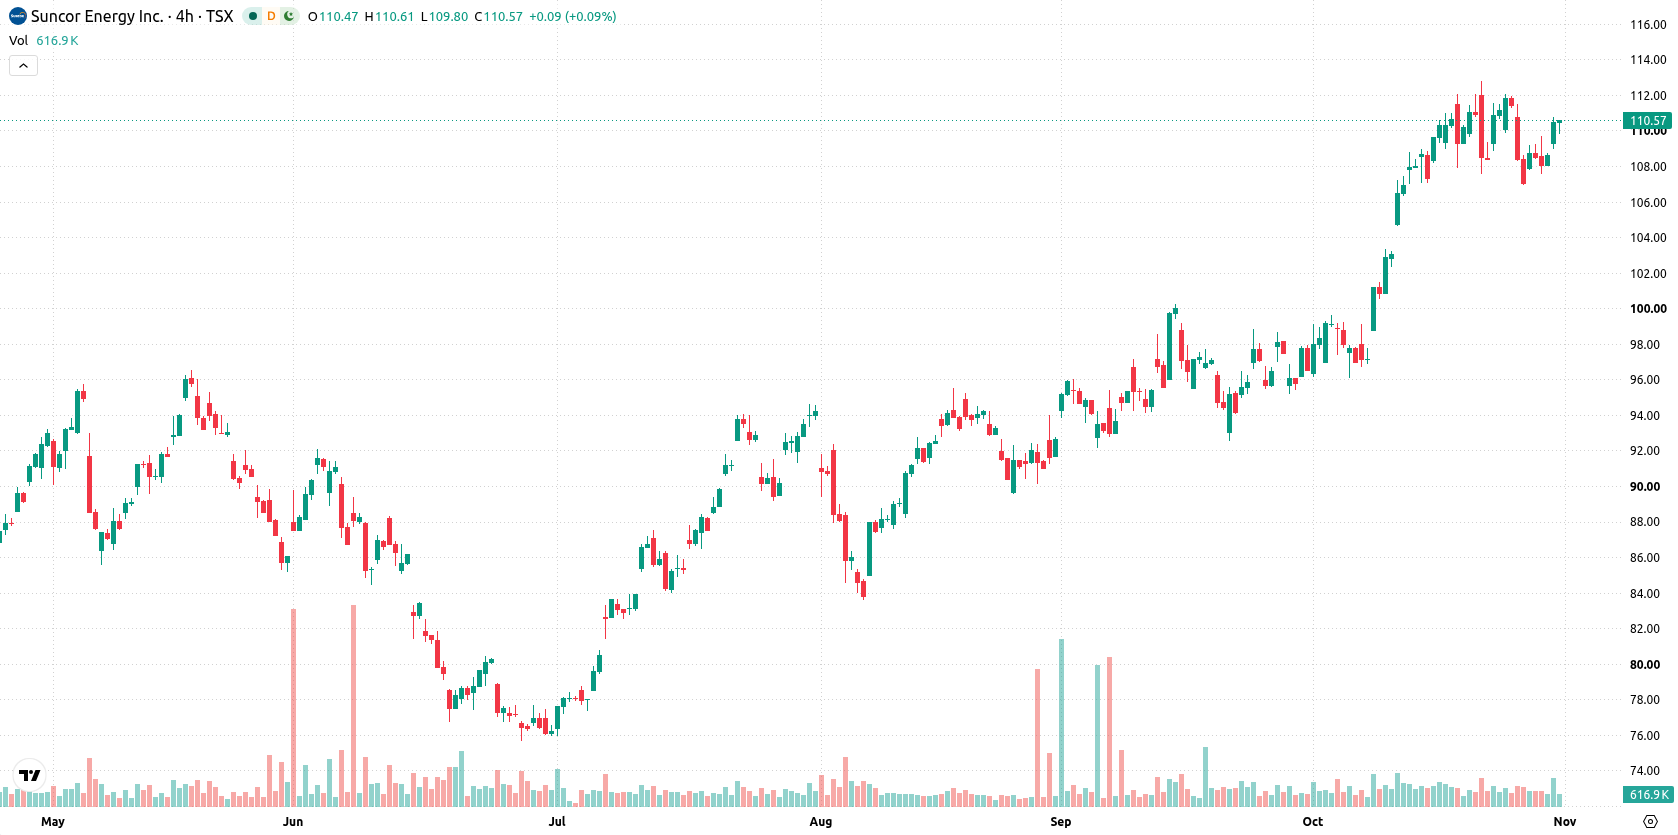
Momentum persists as price tests upper boundary amid mixed signals
Suncor Energy trades above the 20-day (C$105.66), 50-day (C$99.14), and 200-day (C$87.69) moving averages, confirming strength in short-, medium-, and long-term trends. The Ichimoku Kijun at C$103.82 reflects a sustained bullish structure, with the current price holding above both the near-term ceiling at C$112.03 and immediate floor at C$110.54. Momentum signals remain robust, as the MACD at 3.93 forecasts a Strong Buy and the ADX at 28.81 indicates a prevailing trend. The RSI at 60.42 shows moderate upward momentum, while the Stochastic RSI at 16.09 signals an oversold reading and the CCI is neutral at 43.14. Bull/Bear Power (BBP) at 1.93 points to intraday buyer dominance and highlights overbought risk. On the session, the stock rose C$2.21 or 2.03% following an initial upside gap of about 0.77%. The price remains near its session high, with intraday volatility at 1.25%. Action throughout the session reflected steady strength toward the highs, and overall momentum continues to support the advance despite mixed signals from oversold and overbought indicators.
Earlier, analysts noted that Suncor Energy was exhibiting range-bound behavior with breakout potential hinging on confirmation from technical indicators. The current setup reinforces the bullish trend with fresh momentum ahead of key earnings, making a sustained move beyond C$113.39 the level to watch for signs of further upside.






Latest Suncor Energy News


-
 Afghanistan
-
 Albania
-
 Algeria
-
 Angola
-
 Argentina
-
 Armenia
-
 Australia
-
 Austria
-
 Azerbaijan
-
 Bahamas
-
 Bahrain
-
 Bangladesh
-
 Belarus
-
 Belgium
-
 Bolivia
-
 Botswana
-
 Brazil
-
 Brunei
-
 Bulgaria
-
 Cambodia
-
 Cameroon
-
 Canada
-
 Chile
-
 China
-
 Colombia
-
 Congo
-
 Costa Rica
-
 Cote d'Ivoire
-
 Croatia
-
 Cuba
-
 Cyprus
-
 Czechia
-
 DR Congo
-
 Denmark
-
 Dominican Republic
-
 Ecuador
-
 Egypt
-
 El Salvador
-
 Estonia
-
 Eswatini
-
 Ethiopia
-
 Finland
-
 France
-
 Georgia
-
 Germany
-
 Ghana
-
 Greece
-
 Haiti
-
 Hong Kong
-
 Hungary
-
 India
-
 Indonesia
-
 Iran, Islamic republic
-
 Iraq
-
 Ireland
-
 Israel
-
 Italy
-
 Jamaica
-
 Japan
-
 Jordan
-
 Kazakhstan
-
 Kenya
-
 Korea
-
 Kuwait
-
 Kyrgyzstan
-
 Laos
-
 Latvia
-
 Lebanon
-
 Lesotho
-
 Libya
-
 Lithuania
-
 Luxembourg
-
 Madagascar
-
 Malaysia
-
 Malta
-
 Mauritius
-
 Mexico
-
 Moldova
-
 Mongolia
-
 Montenegro
-
 Morocco
-
 Mozambique
-
 Myanmar
-
 Namibia
-
 Nepal
-
 Netherlands
-
 New Zealand
-
 Nigeria
-
 North Macedonia
-
 Norway
-
 Oman
-
 Pakistan
-
 Palestine
-
 Panama
-
 Papua New Guinea
-
 Paraguay
-
 Peru
-
 Philippines
-
 Poland
-
 Portugal
-
 Puerto Rico
-
 Qatar
-
 Reunion
-
 Romania
-
 Rwanda
-
 Saudi Arabia
-
 Serbia
-
 Singapore
-
 Slovakia
-
 Slovenia
-
 Somalia
-
 South Africa
-
 Spain
-
 Sri Lanka
-
 Sweden
-
 Switzerland
-
 Syria
-
 Taiwan
-
 Tajikistan
-
 Tanzania
-
 Thailand
-
 Trinidad and Tobago
-
 Tunisia
-
 Turkey
-
 UAE
-
 Uganda
-
 Ukraine
-
 United Kingdom
-
United States
-
 Uruguay
-
 Uzbekistan
-
 Venezuela
-
 Vietnam
-
 Yemen
-
 Zambia
-
 Zimbabwe
- Forex
- Crypto












