


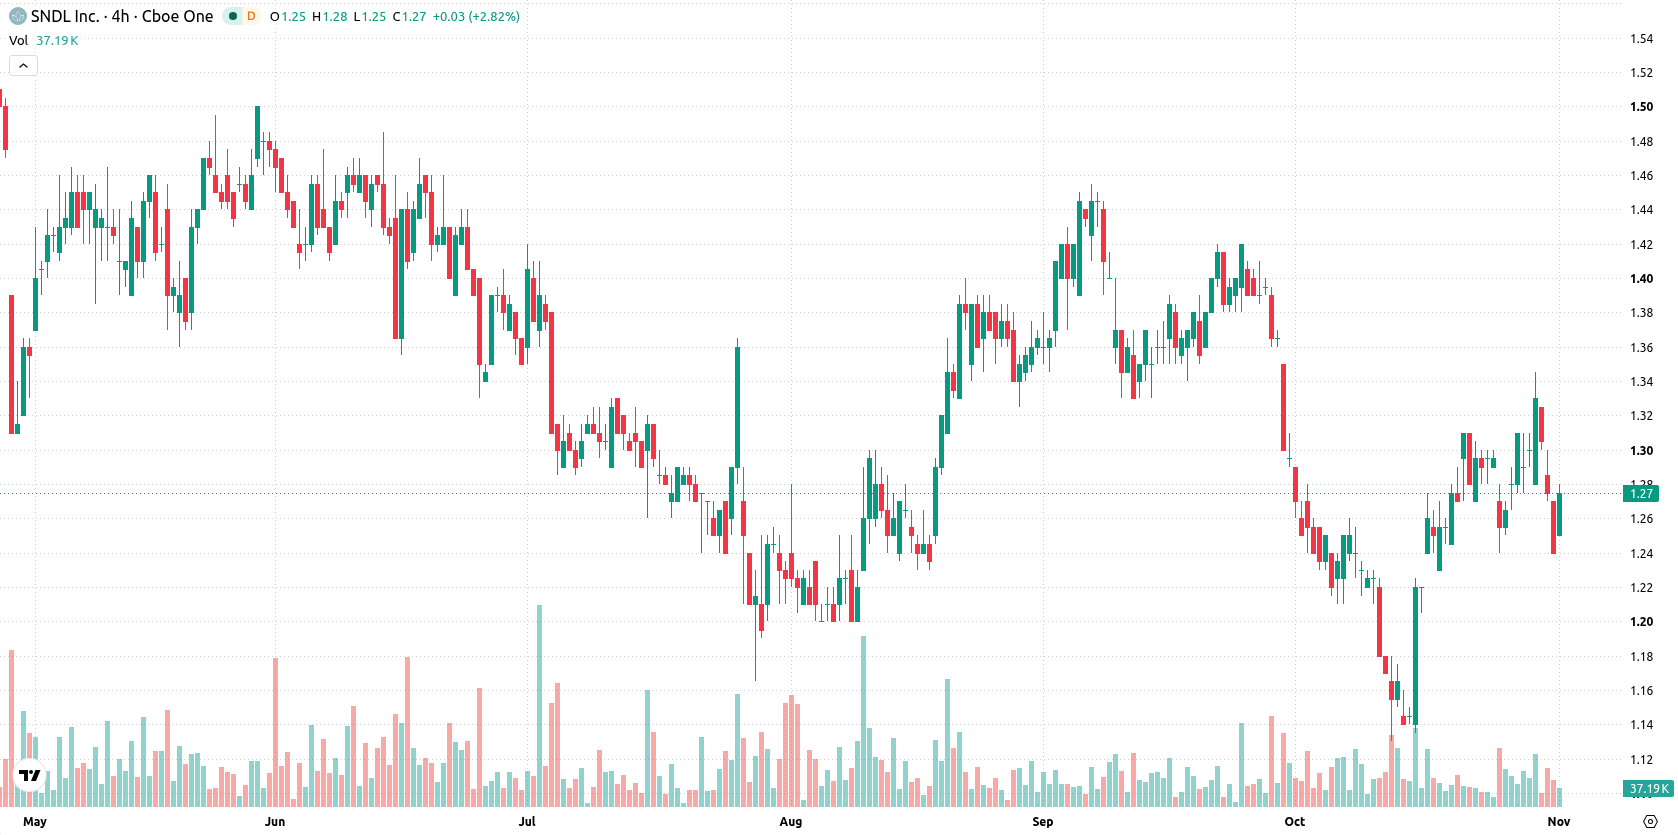
SNDL Inc. (SNDL) jumped 4.82% today as near-term technical momentum and strong intraday buying pushed the stock higher in the absence of fresh news catalysts. The rebound contradicts the broader bearish setup, with SNDL still trading below its 50- and 200-day moving averages, indicating caution for sustained upside.
 1.31
1.34
Highlights
- SNDL stock is trading above near-term support at $1.27 but below key longer-term averages, showing short-term strength within a broader bearish setup.
- Technical indicators present mixed signals, with strong selling momentum, weak trend clarity, and most oscillators forecasting continued downside.
- The stock traded up 4.82% to session highs, with a 5-day forecasted range of $1.22 to $1.36 and a high probability of a downward move.
Technical boundaries hold as mixed momentum clouds breakout risk
SNDL is trading above the 20-day moving average at $1.25, but remains below the 50-day at $1.32 and the 200-day at $1.39, indicating near-term strength within a broader bearish structure. The price stands above the Ichimoku Kijun support at $1.27, with resistance at $1.32 and nearby support at $1.28. Momentum signals are mixed: the MACD points to strong selling, the ADX remains neutral, and the RSI at 44.23 and CCI at 28.27 both reflect neutral territory. The Stochastic RSI signals strong selling pressure. Bull/Bear Power at 0.03 shows buyers narrowly dominating intraday activity, while the Awesome Oscillator remains neutral, not confirming the active trend. Intraday volatility is 1.59%, with SNDL holding near session highs, diverging from negative momentum indicators.
Earlier, analysts noted that SNDL was experiencing persistent selling pressure within a bearish technical setup. The recent intraday rebound highlights short-term buyer interest but, given the broader context, traders should closely monitor the $1.28 support as a potential pivot for near-term risk.









-
 Afghanistan
-
 Albania
-
 Algeria
-
 Angola
-
 Argentina
-
 Armenia
-
 Australia
-
 Austria
-
 Azerbaijan
-
 Bahamas
-
 Bahrain
-
 Bangladesh
-
 Belarus
-
 Belgium
-
 Bolivia
-
 Botswana
-
 Brazil
-
 Brunei
-
 Bulgaria
-
 Cambodia
-
 Cameroon
-
 Canada
-
 Chile
-
 China
-
 Colombia
-
 Congo
-
 Costa Rica
-
 Cote d'Ivoire
-
 Croatia
-
 Cuba
-
 Cyprus
-
 Czechia
-
 DR Congo
-
 Denmark
-
 Dominican Republic
-
 Ecuador
-
 Egypt
-
 El Salvador
-
 Estonia
-
 Eswatini
-
 Ethiopia
-
 Finland
-
 France
-
 Georgia
-
 Germany
-
 Ghana
-
 Greece
-
 Haiti
-
 Hong Kong
-
 Hungary
-
 India
-
 Indonesia
-
 Iran, Islamic republic
-
 Iraq
-
 Ireland
-
 Israel
-
 Italy
-
 Jamaica
-
 Japan
-
 Jordan
-
 Kazakhstan
-
 Kenya
-
 Korea
-
 Kuwait
-
 Kyrgyzstan
-
 Laos
-
 Latvia
-
 Lebanon
-
 Lesotho
-
 Libya
-
 Lithuania
-
 Luxembourg
-
 Madagascar
-
 Malaysia
-
 Malta
-
 Mauritius
-
 Mexico
-
 Moldova
-
 Mongolia
-
 Montenegro
-
 Morocco
-
 Mozambique
-
 Myanmar
-
 Namibia
-
 Nepal
-
 Netherlands
-
 New Zealand
-
 Nigeria
-
 North Macedonia
-
 Norway
-
 Oman
-
 Pakistan
-
 Palestine
-
 Panama
-
 Papua New Guinea
-
 Paraguay
-
 Peru
-
 Philippines
-
 Poland
-
 Portugal
-
 Puerto Rico
-
 Qatar
-
 Reunion
-
 Romania
-
 Rwanda
-
 Saudi Arabia
-
 Serbia
-
 Singapore
-
 Slovakia
-
 Slovenia
-
 Somalia
-
 South Africa
-
 Spain
-
 Sri Lanka
-
 Sweden
-
 Switzerland
-
 Syria
-
 Taiwan
-
 Tajikistan
-
 Tanzania
-
 Thailand
-
 Trinidad and Tobago
-
 Tunisia
-
 Turkey
-
 UAE
-
 Uganda
-
 Ukraine
-
 United Kingdom
-
United States
-
 Uruguay
-
 Uzbekistan
-
 Venezuela
-
 Vietnam
-
 Yemen
-
 Zambia
-
 Zimbabwe
- Forex
- Crypto












