

What's behind Amazon's latest 2.8% stock surge?

Amazon.com, Inc. (AMZN) jumped 2.84% after a strong Q3 2026 earnings release, as accelerating revenue growth in Amazon Web Services drove renewed buying interest. The advance looks limited, with the stock still trading below both its 20-day and 50-day moving averages and showing recent technical weakness.
 252.36
255.18
Highlights
- Amazon reported third-quarter 2026 revenue of $201.9 billion, rising 12.1% year over year.
- Amazon Web Services revenue surged 39%, driven by strong cloud and AI demand, and management projects future growth above 40%.
- Shares of Amazon trade below near-term moving averages with negative momentum signals, and the expected five-day range is $237.62 to $258.25 with a high probability of downside.
AI investments and robust AWS growth propel revenue outlook higher
Amazon reported third-quarter 2026 earnings, posting a 12.1% year-over-year rise in revenue to $201.9 billion. Amazon Web Services led the gains, notching 39% growth and marking its fastest pace in nearly five years, aided by strong demand for cloud and AI services. Management noted expectations for AWS growth to remain above 40% in the coming years. The financial update follows strategic investments in AI and custom chips, which are expected to increase near-term capital expenditures.
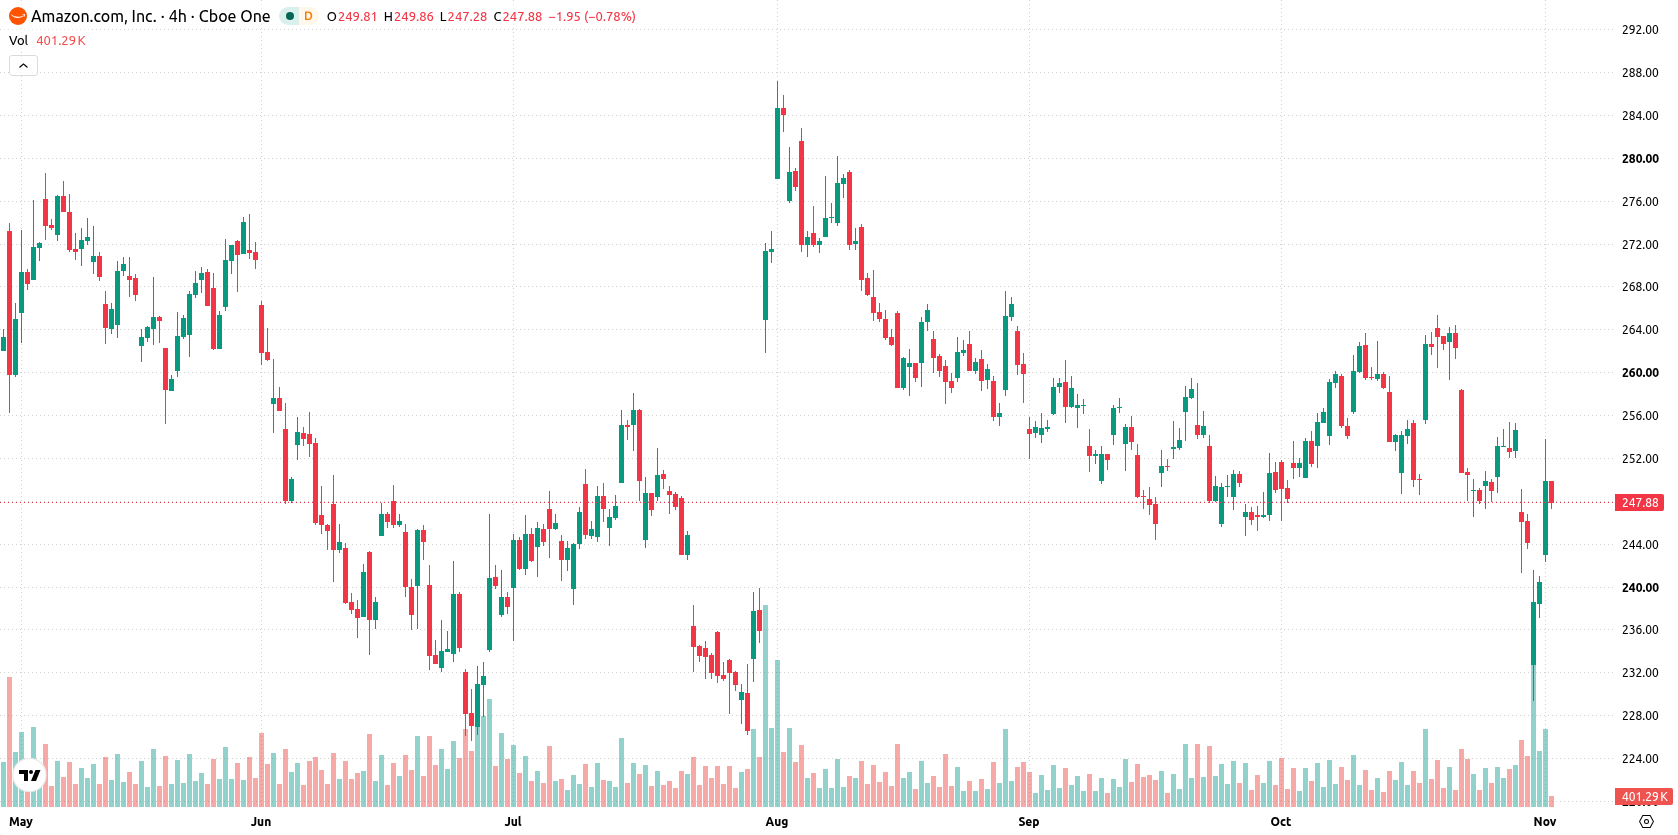
Short-term selling pressure as oversold momentum offsets long-term support
Amazon is trading below both its 20-day and 50-day moving averages ($254.41 and $254.32), suggesting short- and medium-term pressure from sellers, but remains above the 200-day moving average at $243.39. The nearest ceiling is defined by the Ichimoku Kijun at $250.11, with the 200-day moving average acting as the closest floor, and bullish alignment of the 50-day relative to the 200-day MA indicates underlying long-term support. Momentum readings are negative: the Moving Average Convergence Divergence (MACD) signals a sell bias, and the Average Directional Index (ADX) is neutral, reflecting weak ongoing trend strength. The Relative Strength Index (RSI) at 38.35, Commodity Channel Index (CCI) at -209.34, and Stochastic RSI at 0 all highlight oversold conditions, while Bull/Bear Power (BBP) at -9.56 shows sellers dominate intraday momentum, also registering as oversold. The Awesome Oscillator (AO) supports the downside trend. The stock advanced $6.82 or 2.84% today after a downside gap of around $4.75 (1.97%), with the current price near daily highs and intraday volatility at 2.46%. Strength toward the session high is evident, though momentum signals remain firmly negative.
Earlier, analysts noted that Amazon’s ongoing investments and robust cloud growth were offset by concerns over negative free cash flow and the risk of a near-term pullback. The latest technical signals reinforce the prevailing downside scenario, making the $243.39 floor a critical level for traders to monitor in the days ahead.











-
 Afghanistan
-
 Albania
-
 Algeria
-
 Angola
-
 Argentina
-
 Armenia
-
 Australia
-
 Austria
-
 Azerbaijan
-
 Bahamas
-
 Bahrain
-
 Bangladesh
-
 Belarus
-
 Belgium
-
 Bolivia
-
 Botswana
-
 Brazil
-
 Brunei
-
 Bulgaria
-
 Cambodia
-
 Cameroon
-
 Canada
-
 Chile
-
 China
-
 Colombia
-
 Congo
-
 Costa Rica
-
 Cote d'Ivoire
-
 Croatia
-
 Cuba
-
 Cyprus
-
 Czechia
-
 DR Congo
-
 Denmark
-
 Dominican Republic
-
 Ecuador
-
 Egypt
-
 El Salvador
-
 Estonia
-
 Eswatini
-
 Ethiopia
-
 Finland
-
 France
-
 Georgia
-
 Germany
-
 Ghana
-
 Greece
-
 Haiti
-
 Hong Kong
-
 Hungary
-
 India
-
 Indonesia
-
 Iran, Islamic republic
-
 Iraq
-
 Ireland
-
 Israel
-
 Italy
-
 Jamaica
-
 Japan
-
 Jordan
-
 Kazakhstan
-
 Kenya
-
 Korea
-
 Kuwait
-
 Kyrgyzstan
-
 Laos
-
 Latvia
-
 Lebanon
-
 Lesotho
-
 Libya
-
 Lithuania
-
 Luxembourg
-
 Madagascar
-
 Malaysia
-
 Malta
-
 Mauritius
-
 Mexico
-
 Moldova
-
 Mongolia
-
 Montenegro
-
 Morocco
-
 Mozambique
-
 Myanmar
-
 Namibia
-
 Nepal
-
 Netherlands
-
 New Zealand
-
 Nigeria
-
 North Macedonia
-
 Norway
-
 Oman
-
 Pakistan
-
 Palestine
-
 Panama
-
 Papua New Guinea
-
 Paraguay
-
 Peru
-
 Philippines
-
 Poland
-
 Portugal
-
 Puerto Rico
-
 Qatar
-
 Reunion
-
 Romania
-
 Rwanda
-
 Saudi Arabia
-
 Serbia
-
 Singapore
-
 Slovakia
-
 Slovenia
-
 Somalia
-
 South Africa
-
 Spain
-
 Sri Lanka
-
 Sweden
-
 Switzerland
-
 Syria
-
 Taiwan
-
 Tajikistan
-
 Tanzania
-
 Thailand
-
 Trinidad and Tobago
-
 Tunisia
-
 Turkey
-
 UAE
-
 Uganda
-
 Ukraine
-
 United Kingdom
-
United States
-
 Uruguay
-
 Uzbekistan
-
 Venezuela
-
 Vietnam
-
 Yemen
-
 Zambia
-
 Zimbabwe
- Forex
- Crypto












