

Tesco sells Czech and Slovak businesses, eyes Poundland sites: TSCO remains range-bound

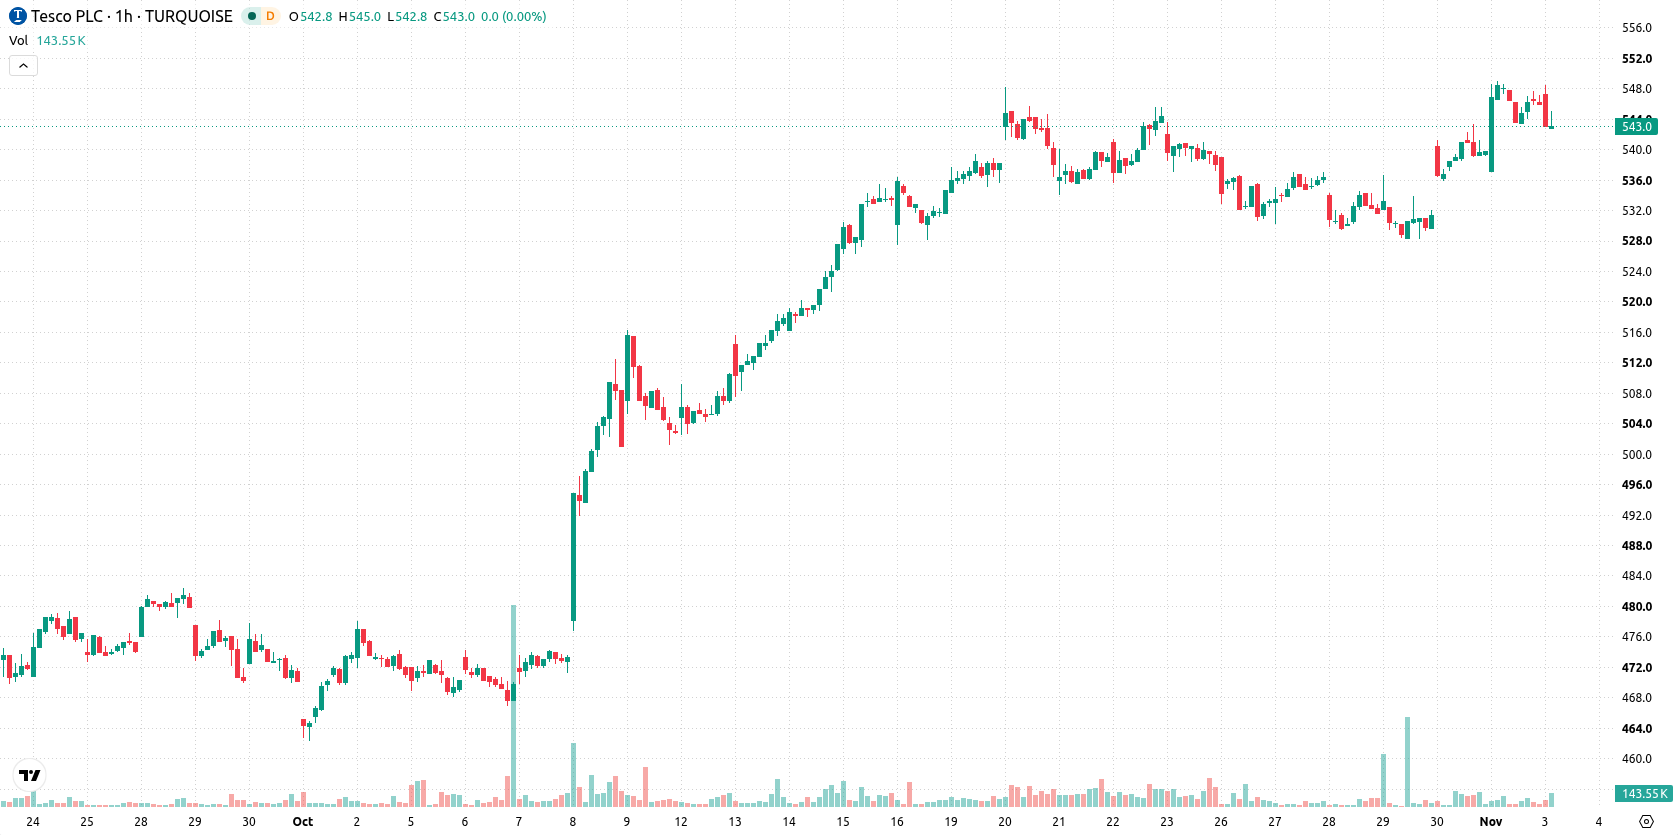
Tesco (TSCO) stock is trading at GBX541.00 with a modest decline since the previous session. The price sits just under its key short-term moving average, while maintaining levels above other significant averages.
 561.00
Highlights
- Tesco will sell its Czech and Slovak operations for €1.7 billion and use €1.2 billion for share buybacks.
- Tesco is in talks to acquire up to 150 Poundland stores, which would increase its presence in UK retail locations.
- Tesco stock trades near session lows with buyers dominating intraday action; expected range is GBX531.7 to GBX550.3 with 74% probability of upside.
Share buybacks and asset sales as Tesco shifts to domestic focus
Tesco's recent agreement to sell its Czech and Slovak businesses for €1.7 billion, with roughly €1.2 billion of the proceeds targeted for share buybacks, marks a strategic shift towards focusing on core UK and Irish markets, according to Yahoo Finance. The allocation of these funds to reduce the share count mechanically increases capital distributed per share and reflects a reallocation of resources from international to domestic priorities. Additionally, Tesco has entered discussions about acquiring up to 150 Poundland stores following Poundland's administration notice, a move that could further expand Tesco's retail presence if completed.
Positive momentum persists as price nears key technical levels
TSCO is trading just below the MA-20 at GBX542.31, but remains above the MA-50 at GBX536.47 on the hourly timeframe and well above the long-term MA-200 at GBX473.06. Immediate support is noted at the Ichimoku Kijun level of GBX538.6. Momentum indicators are showing a positive bias: MACD and ADX both signal Buy, while RSI is at 64.73 and CCI also indicates Buy. Bull/Bear Power signals the stock is overbought, while the Stoch RSI is Neutral and the Awesome Oscillator is also Neutral, revealing some divergence in short-term signals.
Sideways movement likely as breakout risks remain balanced
Over the coming sessions, TSCO is expected to consolidate within the GBX531.7 to GBX550.3 range, representing a typical volatility band relative to current levels. The baseline scenario is continued sideways movement in this corridor. A bullish breakout would be triggered by a close above GBX550.3, signaling potential for further upside, while a drop under GBX531.7 would increase the likelihood of a correction toward lower supports.
Earlier, analysts noted that Tesco’s technical structure remained supportive of an uptrend, driven by both strong momentum indicators and an emphasis on shareholder value through divestments and buybacks. The current developments—especially the potential acquisition of Poundland stores alongside ongoing capital returns—introduce new operational catalysts while reinforcing the need for active monitoring of the GBX550.3 resistance level for signs of an impending breakout.











-
 Afghanistan
-
 Albania
-
 Algeria
-
 Angola
-
 Argentina
-
 Armenia
-
 Australia
-
 Austria
-
 Azerbaijan
-
 Bahamas
-
 Bahrain
-
 Bangladesh
-
 Belarus
-
 Belgium
-
 Bolivia
-
 Botswana
-
 Brazil
-
 Brunei
-
 Bulgaria
-
 Cambodia
-
 Cameroon
-
 Canada
-
 Chile
-
 China
-
 Colombia
-
 Congo
-
 Costa Rica
-
 Cote d'Ivoire
-
 Croatia
-
 Cuba
-
 Cyprus
-
 Czechia
-
 DR Congo
-
 Denmark
-
 Dominican Republic
-
 Ecuador
-
 Egypt
-
 El Salvador
-
 Estonia
-
 Eswatini
-
 Ethiopia
-
 Finland
-
 France
-
 Georgia
-
 Germany
-
 Ghana
-
 Greece
-
 Haiti
-
 Hong Kong
-
 Hungary
-
 India
-
 Indonesia
-
 Iran, Islamic republic
-
 Iraq
-
 Ireland
-
 Israel
-
 Italy
-
 Jamaica
-
 Japan
-
 Jordan
-
 Kazakhstan
-
 Kenya
-
 Korea
-
 Kuwait
-
 Kyrgyzstan
-
 Laos
-
 Latvia
-
 Lebanon
-
 Lesotho
-
 Libya
-
 Lithuania
-
 Luxembourg
-
 Madagascar
-
 Malaysia
-
 Malta
-
 Mauritius
-
 Mexico
-
 Moldova
-
 Mongolia
-
 Montenegro
-
 Morocco
-
 Mozambique
-
 Myanmar
-
 Namibia
-
 Nepal
-
 Netherlands
-
 New Zealand
-
 Nigeria
-
 North Macedonia
-
 Norway
-
 Oman
-
 Pakistan
-
 Palestine
-
 Panama
-
 Papua New Guinea
-
 Paraguay
-
 Peru
-
 Philippines
-
 Poland
-
 Portugal
-
 Puerto Rico
-
 Qatar
-
 Reunion
-
 Romania
-
 Rwanda
-
 Saudi Arabia
-
 Serbia
-
 Singapore
-
 Slovakia
-
 Slovenia
-
 Somalia
-
 South Africa
-
 Spain
-
 Sri Lanka
-
 Sweden
-
 Switzerland
-
 Syria
-
 Taiwan
-
 Tajikistan
-
 Tanzania
-
 Thailand
-
 Trinidad and Tobago
-
 Tunisia
-
 Turkey
-
 UAE
-
 Uganda
-
 Ukraine
-
 United Kingdom
-
United States
-
 Uruguay
-
 Uzbekistan
-
 Venezuela
-
 Vietnam
-
 Yemen
-
 Zambia
-
 Zimbabwe
- Forex
- Crypto












