

IBM shares drop almost 3% after upside gap reversal despite lack of fresh company-specific news

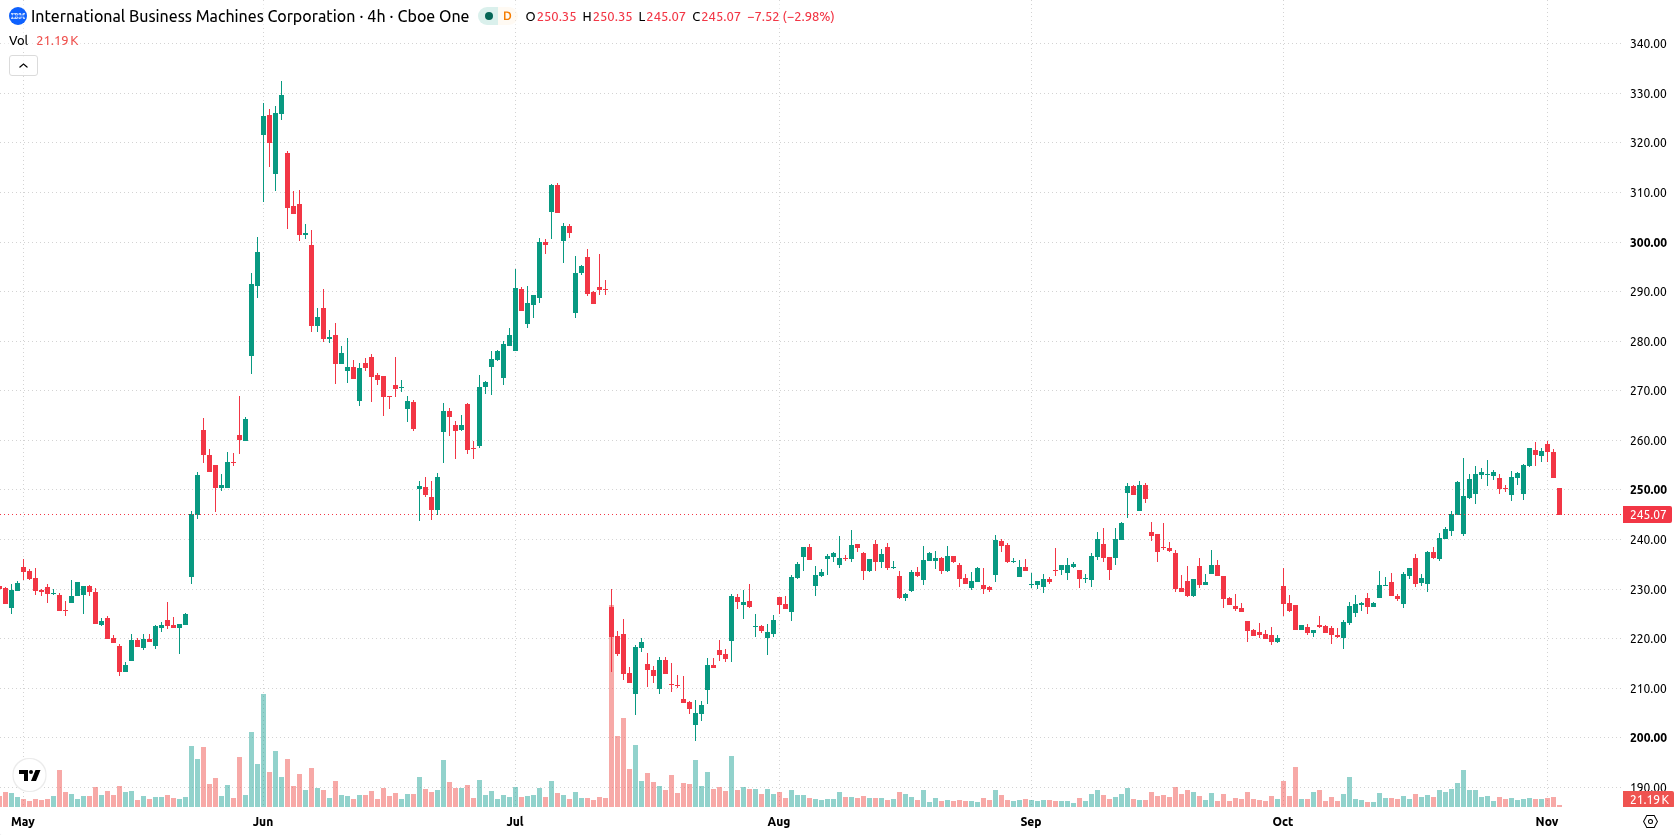
International Business Machines Corporation (IBM) dropped 2.71% on pronounced intraday selling pressure and a reversal following an upside gap, as no fresh company-specific news emerged to trigger the move. The pullback is encountering some near-term limits, with IBM still holding above its 20- and 50-day moving averages but facing longer-term resistance below its 200-day average.
 258.59
259.87
Highlights
- Shares of IBM are trading above short- and medium-term averages but remain below the long-term average, signaling bullish momentum with longer-term resistance.
- Technical momentum indicators generally support an upward move, with intraday buyers dominating and neutral readings from oscillators.
- For the next five sessions, IBM stock is expected to trade between $239.68 and $253.73, with a 64% probability of an upward move.
Bullish medium-term bias amid mixed momentum indicators
IBM is trading above its 20-day moving average at $240.51 and the 50-day moving average at $235.54, but it remains just below the 200-day moving average at $248.95. This points to a bullish structure for the near and medium term, while the longer-term trend stays bearish. The nearest support is at $240.51, with the closest resistance at $247.74. Momentum signals are diverging: MACD and ADX suggest bullish momentum, while the RSI, Stochastic RSI, and CCI are all in neutral zones. Bull/Bear Power shows buyers dominating intraday, and the Awesome Oscillator supports a positive bias. Intraday volatility is high, and despite a strong open, the price is now near the session low as the early upside gap is met with selling.
Earlier, analysts noted that IBM's rebound was under scrutiny as the stock encountered resistance following its recent recovery. With current technical signals now pointing to a bullish near-term structure but heightened volatility, traders should monitor the $239.68–$253.73 range for potential breakouts over the next week.











-
 Afghanistan
-
 Albania
-
 Algeria
-
 Angola
-
 Argentina
-
 Armenia
-
 Australia
-
 Austria
-
 Azerbaijan
-
 Bahamas
-
 Bahrain
-
 Bangladesh
-
 Belarus
-
 Belgium
-
 Bolivia
-
 Botswana
-
 Brazil
-
 Brunei
-
 Bulgaria
-
 Cambodia
-
 Cameroon
-
 Canada
-
 Chile
-
 China
-
 Colombia
-
 Congo
-
 Costa Rica
-
 Cote d'Ivoire
-
 Croatia
-
 Cuba
-
 Cyprus
-
 Czechia
-
 DR Congo
-
 Denmark
-
 Dominican Republic
-
 Ecuador
-
 Egypt
-
 El Salvador
-
 Estonia
-
 Eswatini
-
 Ethiopia
-
 Finland
-
 France
-
 Georgia
-
 Germany
-
 Ghana
-
 Greece
-
 Haiti
-
 Hong Kong
-
 Hungary
-
 India
-
 Indonesia
-
 Iran, Islamic republic
-
 Iraq
-
 Ireland
-
 Israel
-
 Italy
-
 Jamaica
-
 Japan
-
 Jordan
-
 Kazakhstan
-
 Kenya
-
 Korea
-
 Kuwait
-
 Kyrgyzstan
-
 Laos
-
 Latvia
-
 Lebanon
-
 Lesotho
-
 Libya
-
 Lithuania
-
 Luxembourg
-
 Madagascar
-
 Malaysia
-
 Malta
-
 Mauritius
-
 Mexico
-
 Moldova
-
 Mongolia
-
 Montenegro
-
 Morocco
-
 Mozambique
-
 Myanmar
-
 Namibia
-
 Nepal
-
 Netherlands
-
 New Zealand
-
 Nigeria
-
 North Macedonia
-
 Norway
-
 Oman
-
 Pakistan
-
 Palestine
-
 Panama
-
 Papua New Guinea
-
 Paraguay
-
 Peru
-
 Philippines
-
 Poland
-
 Portugal
-
 Puerto Rico
-
 Qatar
-
 Reunion
-
 Romania
-
 Rwanda
-
 Saudi Arabia
-
 Serbia
-
 Singapore
-
 Slovakia
-
 Slovenia
-
 Somalia
-
 South Africa
-
 Spain
-
 Sri Lanka
-
 Sweden
-
 Switzerland
-
 Syria
-
 Taiwan
-
 Tajikistan
-
 Tanzania
-
 Thailand
-
 Trinidad and Tobago
-
 Tunisia
-
 Turkey
-
 UAE
-
 Uganda
-
 Ukraine
-
 United Kingdom
-
United States
-
 Uruguay
-
 Uzbekistan
-
 Venezuela
-
 Vietnam
-
 Yemen
-
 Zambia
-
 Zimbabwe
- Forex
- Crypto












