

Intel stock rebounds amid oversold technical signals limiting further selling

Intel (INTC) stock is trading at $61.49, up 2.65% on the day. The price remains below its key moving averages, signaling persistent downward pressure despite today's rebound.
 62.59
95.68
Highlights
- Intel projected fourth-quarter 2026 revenue and adjusted EPS far below analyst estimates and warned of worsening PC market conditions.
- Shares of Intel dropped 28.6% on October 30, 2026, recording the stock's steepest single-day decline since 1974 after the forecast and a $300 million revenue impact from a factory accident in Israel.
- Price action remains bearish with downside momentum prevailing and a 67% probability of decline within the $49.19 to $73.79 range over the next few days.
Stock plunge intensifies as weak outlook meets operational setbacks
Intel issued fourth-quarter 2026 guidance for both revenue and adjusted EPS that came in well below analyst expectations, while also warning of deteriorating PC market conditions and a significant $300 million revenue hit from a factory accident in Israel, according to Investing.com. This outlook prompted the steepest single-day decline in Intel's stock since 1974, with shares dropping 28.6% on October 30, 2026, as reported by Trefis and Benzinga, reflecting the market's reaction to deteriorating fundamentals and operational setbacks. Additionally, the company emphasized ongoing challenges in its PC business despite strength in AI-driven server processor demand, underscoring investor uncertainty about the business split, as noted by Yahoo Finance.
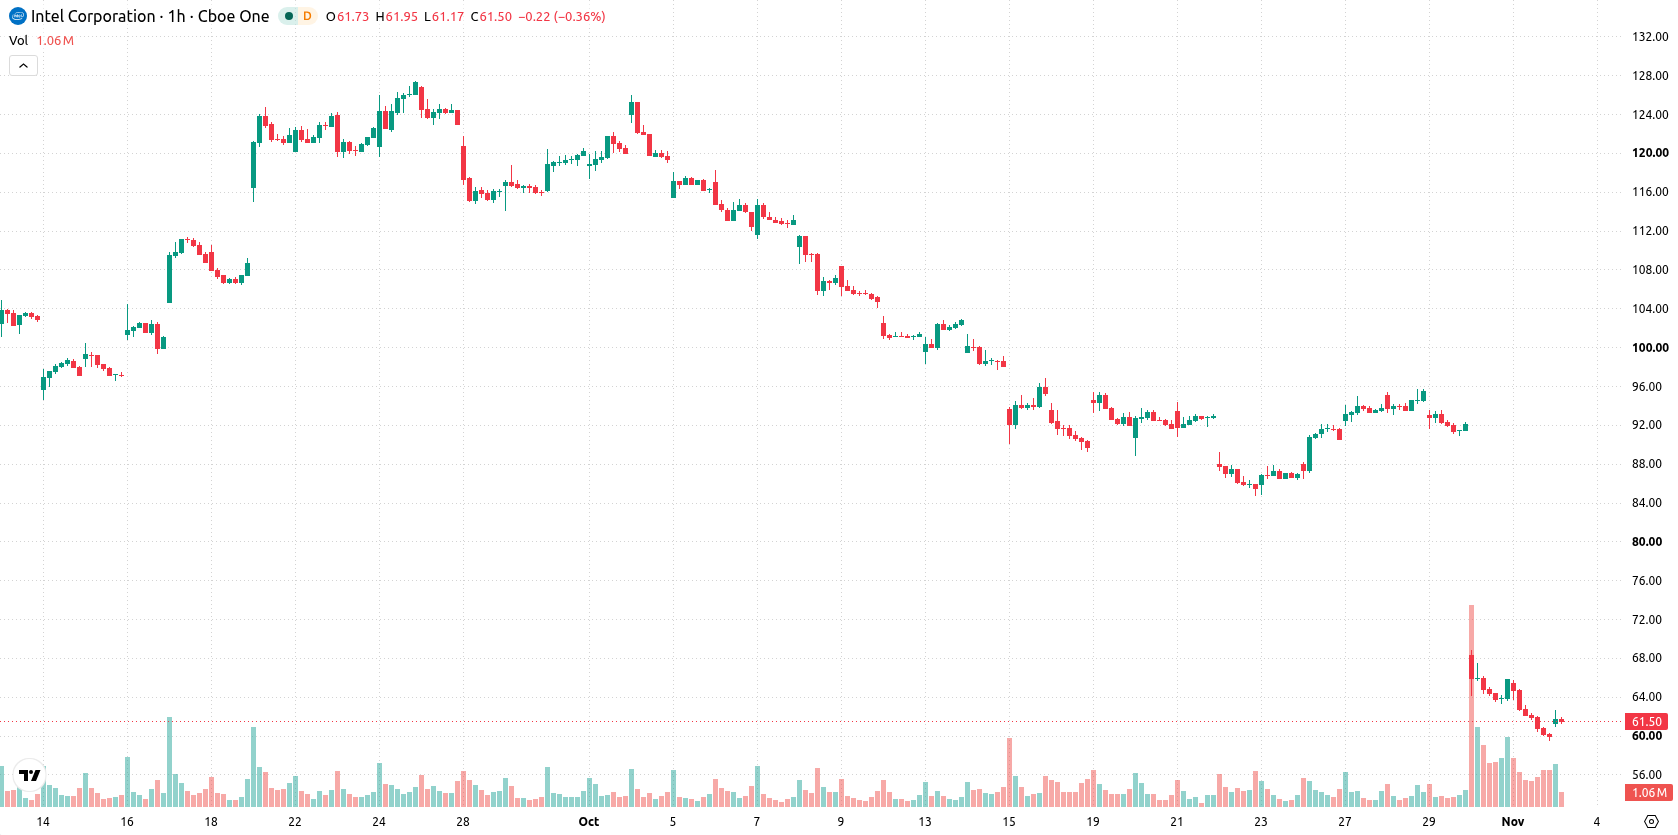
Bearish trend persists as major indicators show mixed momentum
Price is trading below the MA-20, MA-50, and MA-200, indicating that short-, medium-, and long-term trends remain under bearish pressure. The Ichimoku Kijun at $77.55 acts as immediate resistance, marking a key level for potential reversals. Bearish signals remain active on both MACD and ADX, confirming ongoing downward momentum. RSI is currently in the oversold zone, suggesting the possibility of selling exhaustion, while Stochastic RSI and CCI are neutral. Bull/Bear Power is negative, signaling continued seller dominance intraday, though the Awesome Oscillator reads neutral, and overall indicator signals remain mixed with heightened volatility.
Downside risk prevails as volatility complicates near-term outlook
In the next two to three trading days, price is expected to fluctuate within the $49.19 to $73.79 range—a broad volatility band relative to current levels. The baseline scenario calls for consolidation within this channel, given conflicting momentum signals and pronounced intraday swings. While the probability of an upward move is 33%, a downside continuation holds a higher likelihood at 67%. A decisive bullish scenario requires a break above immediate resistance, whereas a downside scenario could unfold if price breaches the forecasted support.
Earlier, analysts noted that Intel faced persistent downside risk and volatility following disappointing guidance and a sharp earnings-driven selloff. The current article adds further weight to this cautious outlook, highlighting ongoing technical weakness and operational headwinds, with traders advised to monitor the $49.19 to $73.79 price range for near-term direction.











-
 Afghanistan
-
 Albania
-
 Algeria
-
 Angola
-
 Argentina
-
 Armenia
-
 Australia
-
 Austria
-
 Azerbaijan
-
 Bahamas
-
 Bahrain
-
 Bangladesh
-
 Belarus
-
 Belgium
-
 Bolivia
-
 Botswana
-
 Brazil
-
 Brunei
-
 Bulgaria
-
 Cambodia
-
 Cameroon
-
 Canada
-
 Chile
-
 China
-
 Colombia
-
 Congo
-
 Costa Rica
-
 Cote d'Ivoire
-
 Croatia
-
 Cuba
-
 Cyprus
-
 Czechia
-
 DR Congo
-
 Denmark
-
 Dominican Republic
-
 Ecuador
-
 Egypt
-
 El Salvador
-
 Estonia
-
 Eswatini
-
 Ethiopia
-
 Finland
-
 France
-
 Georgia
-
 Germany
-
 Ghana
-
 Greece
-
 Haiti
-
 Hong Kong
-
 Hungary
-
 India
-
 Indonesia
-
 Iran, Islamic republic
-
 Iraq
-
 Ireland
-
 Israel
-
 Italy
-
 Jamaica
-
 Japan
-
 Jordan
-
 Kazakhstan
-
 Kenya
-
 Korea
-
 Kuwait
-
 Kyrgyzstan
-
 Laos
-
 Latvia
-
 Lebanon
-
 Lesotho
-
 Libya
-
 Lithuania
-
 Luxembourg
-
 Madagascar
-
 Malaysia
-
 Malta
-
 Mauritius
-
 Mexico
-
 Moldova
-
 Mongolia
-
 Montenegro
-
 Morocco
-
 Mozambique
-
 Myanmar
-
 Namibia
-
 Nepal
-
 Netherlands
-
 New Zealand
-
 Nigeria
-
 North Macedonia
-
 Norway
-
 Oman
-
 Pakistan
-
 Palestine
-
 Panama
-
 Papua New Guinea
-
 Paraguay
-
 Peru
-
 Philippines
-
 Poland
-
 Portugal
-
 Puerto Rico
-
 Qatar
-
 Reunion
-
 Romania
-
 Rwanda
-
 Saudi Arabia
-
 Serbia
-
 Singapore
-
 Slovakia
-
 Slovenia
-
 Somalia
-
 South Africa
-
 Spain
-
 Sri Lanka
-
 Sweden
-
 Switzerland
-
 Syria
-
 Taiwan
-
 Tajikistan
-
 Tanzania
-
 Thailand
-
 Trinidad and Tobago
-
 Tunisia
-
 Turkey
-
 UAE
-
 Uganda
-
 Ukraine
-
 United Kingdom
-
United States
-
 Uruguay
-
 Uzbekistan
-
 Venezuela
-
 Vietnam
-
 Yemen
-
 Zambia
-
 Zimbabwe
- Forex
- Crypto












