

About 1.5% drop for Ibovespa as technical signals confirm bearish momentum

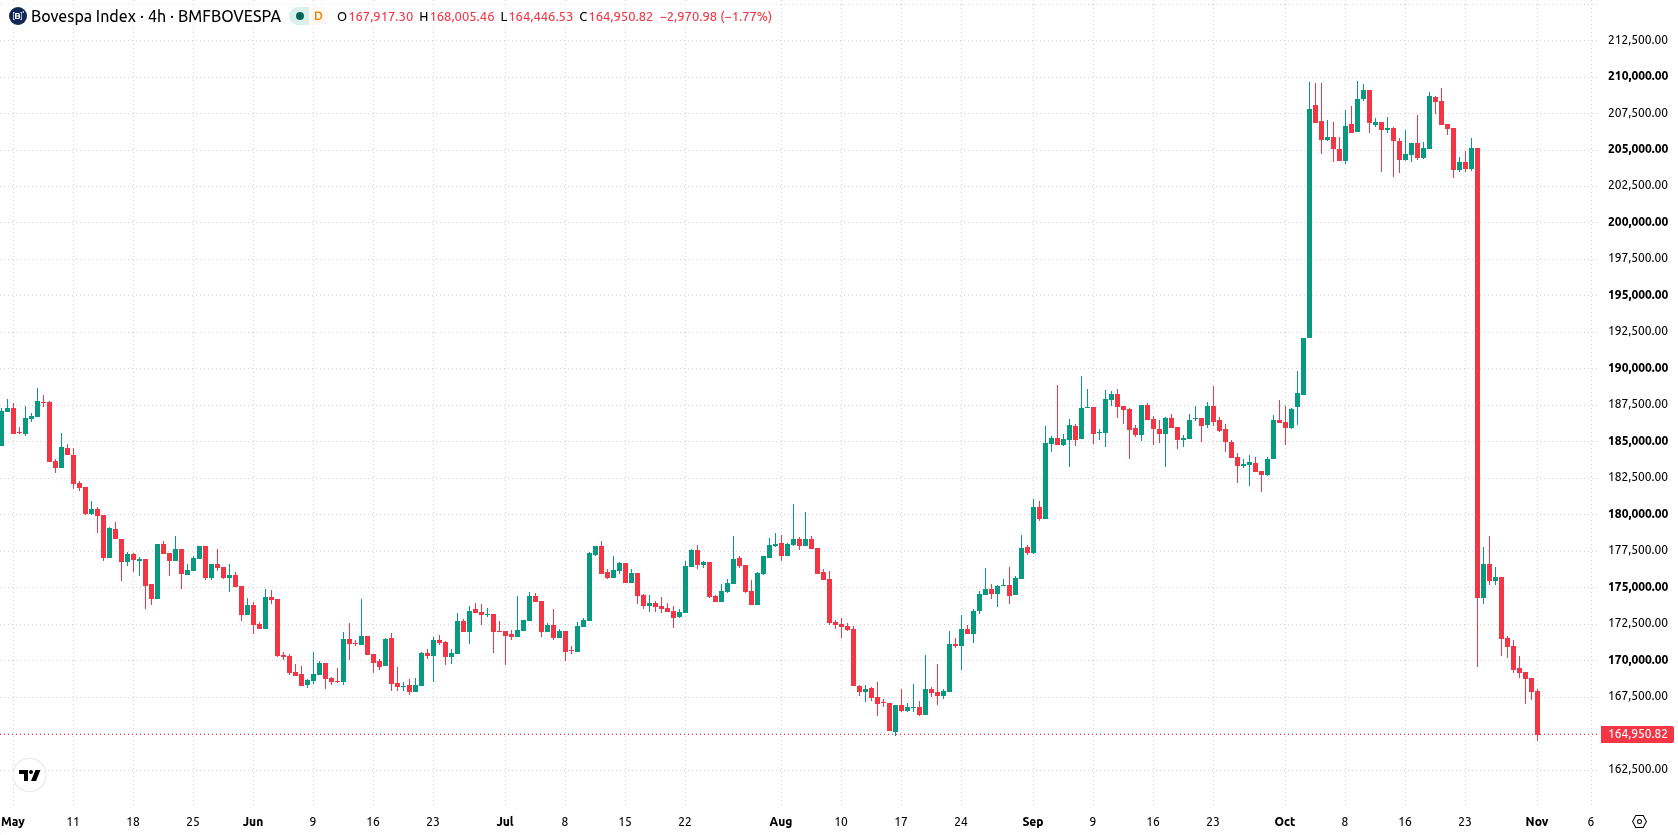
Ibovespa Index (IBOV) fell 1.57% as fiscal uncertainty and investor caution around Brazil's economic policies drove heavy selling pressure. The drop is reinforced by the index trading below all key moving averages, signaling that bearish momentum continues to dominate.
 168498.42
172707.28
Highlights
- The Ibovespa index continued its decline in early November as fiscal uncertainty and changing economic policies raised investor caution.
- Petrobras shares fell sharply, creating additional volatility amid upcoming Copom decisions and mixed domestic economic data.
- Ibovespa trades below key moving averages with strong bearish momentum, projected to fluctuate between 160,402 and 169,356 in the next five days.
Selling intensifies amid post-election policy uncertainty and volatile sentiment
The Ibovespa index recorded significant volatility in early November, continuing a decline that started after the Brazilian presidential elections. The October drop was attributed to fiscal uncertainty, rising interest rates, and investor caution regarding the new government's economic policies. Petrobras shares also experienced sharp declines, and additional uncertainty was created by upcoming decisions from the Central Bank's Monetary Policy Committee (Copom) and mixed domestic economic data.
Sustained bearish pressure as downside momentum meets oversold signals
Ibovespa is trading below its 20-day (196,829), 50-day (188,203), and 200-day (181,771) moving averages, indicating sustained downward pressure across short-, medium-, and long-term trends. The nearest technical ceiling is at 167,045 (week low), with support at 164,446 (today low). The 50-day and 200-day moving averages align in a bullish structure but remain well above the current price, confirming a prevailing bearish trend. Momentum indicators such as MACD and ADX signal strong bearish momentum, while the RSI, Stochastic RSI, and CCI are all in oversold zones, suggesting selling exhaustion may be developing but without a clear rebound confirmation. BBP remains firmly negative, showing sellers are in control, and the Awesome Oscillator further aligns with the bearish outlook. Intraday volatility is elevated at 2.16%, and the index is hovering near its session low, with intraday and momentum signals consistently pointing toward prevailing bearishness.
Earlier, analysts noted that ongoing fiscal and political uncertainty had left the Ibovespa in a vulnerable technical position characterized by pronounced downside risk. The latest data reinforce this bearish outlook, and with the index now facing a 78% probability of further declines, traders should monitor the 164,446 level as a key support for any potential inflection in trend.











-
 Afghanistan
-
 Albania
-
 Algeria
-
 Angola
-
 Argentina
-
 Armenia
-
 Australia
-
 Austria
-
 Azerbaijan
-
 Bahamas
-
 Bahrain
-
 Bangladesh
-
 Belarus
-
 Belgium
-
 Bolivia
-
 Botswana
-
 Brazil
-
 Brunei
-
 Bulgaria
-
 Cambodia
-
 Cameroon
-
 Canada
-
 Chile
-
 China
-
 Colombia
-
 Congo
-
 Costa Rica
-
 Cote d'Ivoire
-
 Croatia
-
 Cuba
-
 Cyprus
-
 Czechia
-
 DR Congo
-
 Denmark
-
 Dominican Republic
-
 Ecuador
-
 Egypt
-
 El Salvador
-
 Estonia
-
 Eswatini
-
 Ethiopia
-
 Finland
-
 France
-
 Georgia
-
 Germany
-
 Ghana
-
 Greece
-
 Haiti
-
 Hong Kong
-
 Hungary
-
 India
-
 Indonesia
-
 Iran, Islamic republic
-
 Iraq
-
 Ireland
-
 Israel
-
 Italy
-
 Jamaica
-
 Japan
-
 Jordan
-
 Kazakhstan
-
 Kenya
-
 Korea
-
 Kuwait
-
 Kyrgyzstan
-
 Laos
-
 Latvia
-
 Lebanon
-
 Lesotho
-
 Libya
-
 Lithuania
-
 Luxembourg
-
 Madagascar
-
 Malaysia
-
 Malta
-
 Mauritius
-
 Mexico
-
 Moldova
-
 Mongolia
-
 Montenegro
-
 Morocco
-
 Mozambique
-
 Myanmar
-
 Namibia
-
 Nepal
-
 Netherlands
-
 New Zealand
-
 Nigeria
-
 North Macedonia
-
 Norway
-
 Oman
-
 Pakistan
-
 Palestine
-
 Panama
-
 Papua New Guinea
-
 Paraguay
-
 Peru
-
 Philippines
-
 Poland
-
 Portugal
-
 Puerto Rico
-
 Qatar
-
 Reunion
-
 Romania
-
 Rwanda
-
 Saudi Arabia
-
 Serbia
-
 Singapore
-
 Slovakia
-
 Slovenia
-
 Somalia
-
 South Africa
-
 Spain
-
 Sri Lanka
-
 Sweden
-
 Switzerland
-
 Syria
-
 Taiwan
-
 Tajikistan
-
 Tanzania
-
 Thailand
-
 Trinidad and Tobago
-
 Tunisia
-
 Turkey
-
 UAE
-
 Uganda
-
 Ukraine
-
 United Kingdom
-
United States
-
 Uruguay
-
 Uzbekistan
-
 Venezuela
-
 Vietnam
-
 Yemen
-
 Zambia
-
 Zimbabwe
- Forex
- Crypto












