

Hims & Hers Health shares technical analysis: Upward price move faces $27.64 resistance

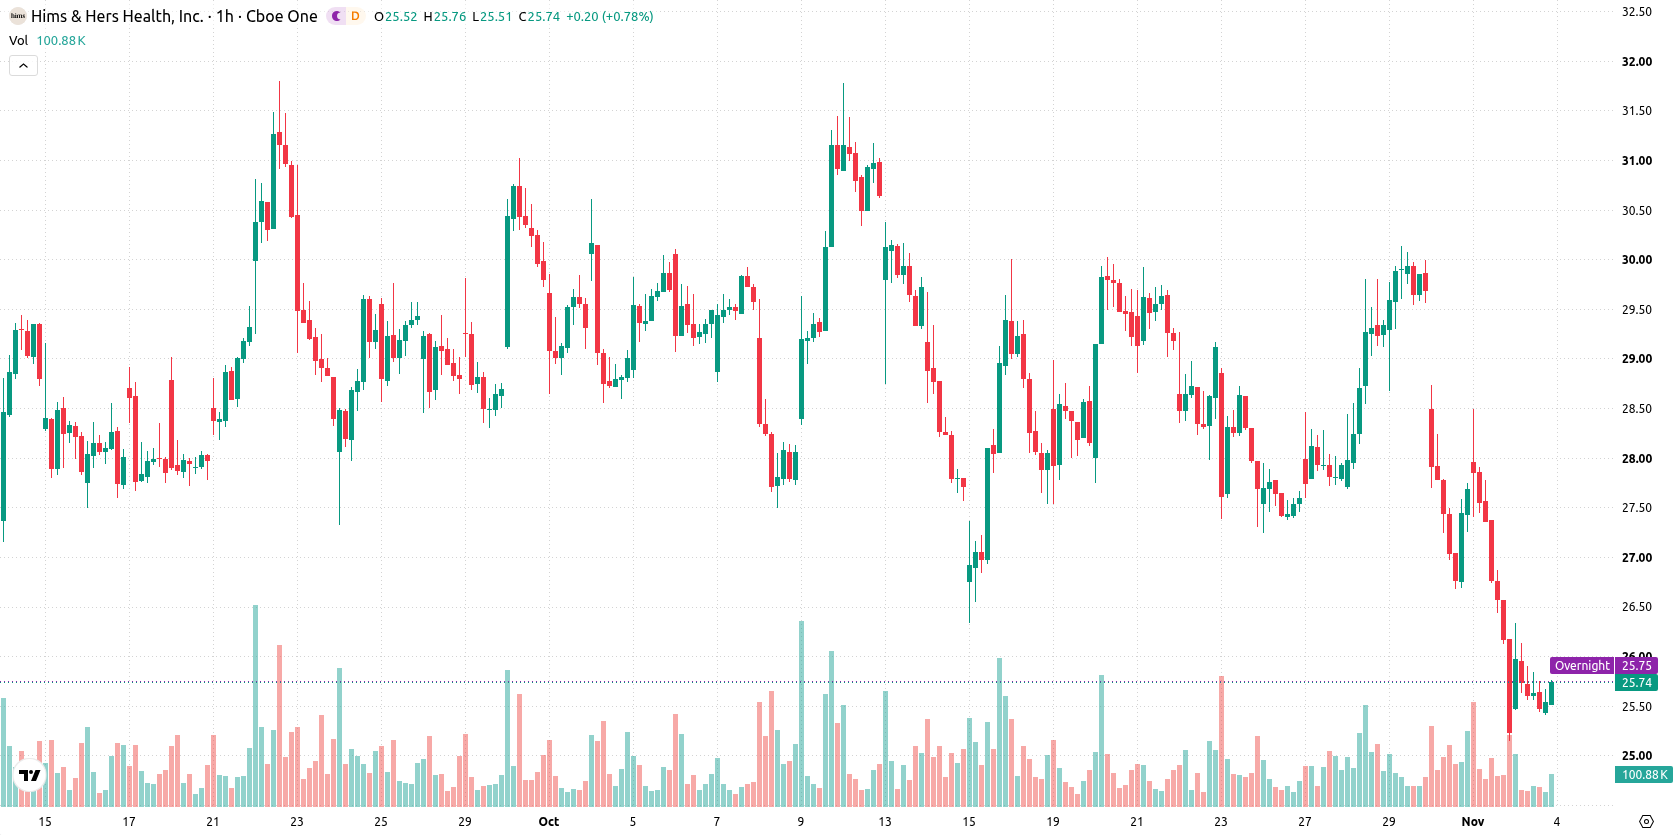
Hims & Hers Health (HIMS) stock is trading at $25.7, advancing 1.84% on the session. The price remains below its key moving averages, reflecting ongoing downward pressure on both short- and long-term timeframes.
 26.23
28.61
Highlights
- HIMS/USD trades below key short-term and long-term moving averages, showing continued downward pressure across primary timeframes.
- Momentum signals such as MACD and ADX support a bearish outlook, with oscillators mostly neutral and no reversal signals in sight.
- Forecast sees a 76% chance of a move lower, with price expected to fluctuate between $23.49 and $27.91 over the next sessions.
Sell momentum prevails amid resistance at Ichimoku Kijun level
On the technical front, HIMS has failed to reclaim the MA-20 and MA-50 on the hourly chart, while also trading below the MA-200 on the daily timeframe. Immediate upside resistance is defined by the Ichimoku Kijun level at $27.64. Momentum indicators show both MACD and ADX signaling sell conditions, while RSI, Stoch RSI, and CCI remain neutral. Bull/Bear Power at –0.37 highlights intraday seller dominance, and the Awesome Oscillator is neutral, not confirming further downside at present. There are no signals from oscillators indicating an imminent reversal.
Downside risk dominates with range-bound outlook and breakout triggers
Looking ahead, HIMS is expected to trade within a volatility band between $23.49 and $27.91 over the next few sessions. The probability of an upward breakout is 24%, while a decline remains more likely at 76%. The base case anticipates sideways movement in this range, with bullish continuation requiring a price close above $27.64, and a bearish scenario unfolding if the stock drops below $23.49.
Earlier, analysts noted that Hims & Hers Health faced persistent technical and legal pressures that contributed to its bearish outlook. The current analysis reinforces this view, highlighting a prevailing downside risk within the established $23.49–$27.91 volatility band and pointing to a critical inflection if the lower boundary is breached.






Latest Hims & Hers News





-
 Afghanistan
-
 Albania
-
 Algeria
-
 Angola
-
 Argentina
-
 Armenia
-
 Australia
-
 Austria
-
 Azerbaijan
-
 Bahamas
-
 Bahrain
-
 Bangladesh
-
 Belarus
-
 Belgium
-
 Bolivia
-
 Botswana
-
 Brazil
-
 Brunei
-
 Bulgaria
-
 Cambodia
-
 Cameroon
-
 Canada
-
 Chile
-
 China
-
 Colombia
-
 Congo
-
 Costa Rica
-
 Cote d'Ivoire
-
 Croatia
-
 Cuba
-
 Cyprus
-
 Czechia
-
 DR Congo
-
 Denmark
-
 Dominican Republic
-
 Ecuador
-
 Egypt
-
 El Salvador
-
 Estonia
-
 Eswatini
-
 Ethiopia
-
 Finland
-
 France
-
 Georgia
-
 Germany
-
 Ghana
-
 Greece
-
 Haiti
-
 Hong Kong
-
 Hungary
-
 India
-
 Indonesia
-
 Iran, Islamic republic
-
 Iraq
-
 Ireland
-
 Israel
-
 Italy
-
 Jamaica
-
 Japan
-
 Jordan
-
 Kazakhstan
-
 Kenya
-
 Korea
-
 Kuwait
-
 Kyrgyzstan
-
 Laos
-
 Latvia
-
 Lebanon
-
 Lesotho
-
 Libya
-
 Lithuania
-
 Luxembourg
-
 Madagascar
-
 Malaysia
-
 Malta
-
 Mauritius
-
 Mexico
-
 Moldova
-
 Mongolia
-
 Montenegro
-
 Morocco
-
 Mozambique
-
 Myanmar
-
 Namibia
-
 Nepal
-
 Netherlands
-
 New Zealand
-
 Nigeria
-
 North Macedonia
-
 Norway
-
 Oman
-
 Pakistan
-
 Palestine
-
 Panama
-
 Papua New Guinea
-
 Paraguay
-
 Peru
-
 Philippines
-
 Poland
-
 Portugal
-
 Puerto Rico
-
 Qatar
-
 Reunion
-
 Romania
-
 Rwanda
-
 Saudi Arabia
-
 Serbia
-
 Singapore
-
 Slovakia
-
 Slovenia
-
 Somalia
-
 South Africa
-
 Spain
-
 Sri Lanka
-
 Sweden
-
 Switzerland
-
 Syria
-
 Taiwan
-
 Tajikistan
-
 Tanzania
-
 Thailand
-
 Trinidad and Tobago
-
 Tunisia
-
 Turkey
-
 UAE
-
 Uganda
-
 Ukraine
-
 United Kingdom
-
United States
-
 Uruguay
-
 Uzbekistan
-
 Venezuela
-
 Vietnam
-
 Yemen
-
 Zambia
-
 Zimbabwe
- Forex
- Crypto












