


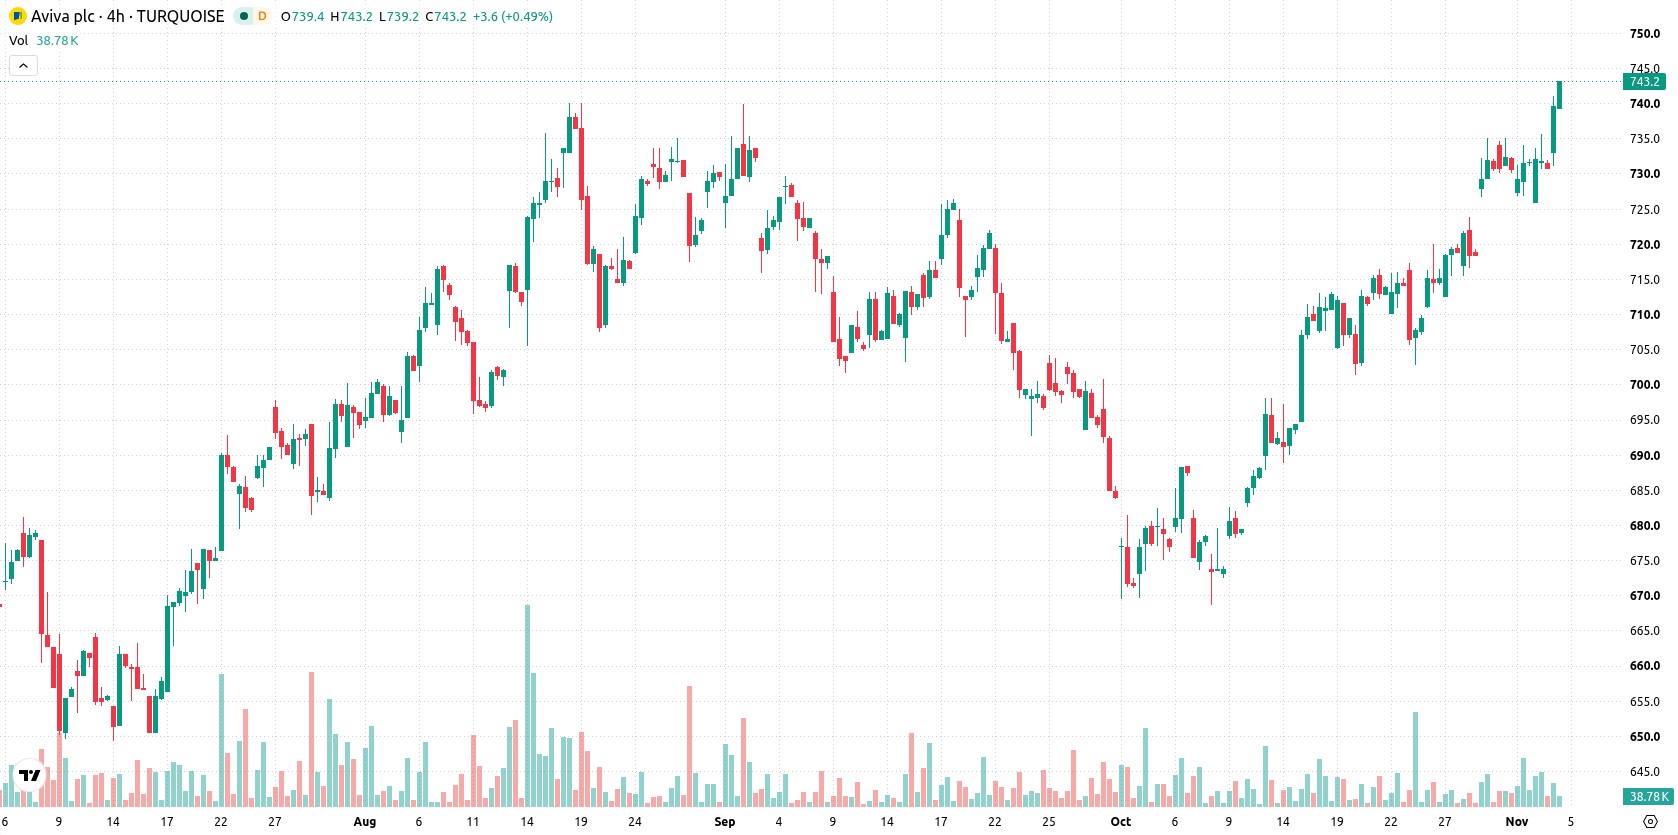
Aviva plc (AV) climbed 2.00% after Aviva Investors adopted Room Zero's enterprise analytics platform, enhancing its operational and client intelligence capabilities. The bullish momentum is supported by the stock trading above its 20-day, 50-day, and 200-day moving averages, reflecting strength across all key time horizons.
 742.20
761.40
Highlights
- Aviva Investors adopted Room Zero's analytics platform to unify assets under management and client data across its business.
- David Martin, formerly of Aviva, was appointed CEO of PIB Group Ltd in the UK.
- Shares of Aviva are trading between GBX738.6 and GBX749.4 on strong bullish momentum, with overbought risk indicated for the near term.
Unified data approach and leadership changes shape Aviva outlook
Aviva Investors, the asset management division of Aviva, has implemented Room Zero's enterprise analytics platform to gain unified insight into assets under management and client data across its business. Additionally, David Martin, formerly of Aviva, was named as the new CEO of U.K.-based PIB Group Ltd. The next scheduled trading update for Aviva is set for November 13.
Bullish trend persists as overbought signals raise fatigue risk
Aviva is trading above its 20-day, 50-day, and 200-day moving averages at GBX744, highlighting bullish momentum on short, medium, and long-term trends. The price is positioned between the calculated support at GBX738.6 and resistance at GBX749.4, with a broad bullish trend signaled by the alignment of the 50-day and 200-day moving averages. Momentum indicators present a mixed picture: the MACD points to a buy signal, marking positive momentum, while the ADX stays neutral and does not confirm a strong trend. The RSI is neutral, but both the Stochastic RSI and Commodity Channel Index (CCI) are in overbought zones, suggesting overheating risk. Bull/Bear Power shows buyers dominating intraday moves, and the Awesome Oscillator confirms overall upward momentum. Trading near session highs, Aviva has displayed muted intraday volatility at 0.36%, supporting the view of persistent bullish sentiment but cautioning on potential rally fatigue from overbought readings.
Earlier, analysts noted that Aviva's price action was characterized by mixed technical momentum and a tendency toward sideways movement within a defined trading range. The latest adoption of enterprise analytics and continued bullish alignment of key moving averages add support to the prevailing consolidation scenario, with traders advised to monitor a breakout above the GBX749.4 resistance as the clearest signal for renewed directional movement.









-
 Afghanistan
-
 Albania
-
 Algeria
-
 Angola
-
 Argentina
-
 Armenia
-
 Australia
-
 Austria
-
 Azerbaijan
-
 Bahamas
-
 Bahrain
-
 Bangladesh
-
 Belarus
-
 Belgium
-
 Bolivia
-
 Botswana
-
 Brazil
-
 Brunei
-
 Bulgaria
-
 Cambodia
-
 Cameroon
-
 Canada
-
 Chile
-
 China
-
 Colombia
-
 Congo
-
 Costa Rica
-
 Cote d'Ivoire
-
 Croatia
-
 Cuba
-
 Cyprus
-
 Czechia
-
 DR Congo
-
 Denmark
-
 Dominican Republic
-
 Ecuador
-
 Egypt
-
 El Salvador
-
 Estonia
-
 Eswatini
-
 Ethiopia
-
 Finland
-
 France
-
 Georgia
-
 Germany
-
 Ghana
-
 Greece
-
 Haiti
-
 Hong Kong
-
 Hungary
-
 India
-
 Indonesia
-
 Iran, Islamic republic
-
 Iraq
-
 Ireland
-
 Israel
-
 Italy
-
 Jamaica
-
 Japan
-
 Jordan
-
 Kazakhstan
-
 Kenya
-
 Korea
-
 Kuwait
-
 Kyrgyzstan
-
 Laos
-
 Latvia
-
 Lebanon
-
 Lesotho
-
 Libya
-
 Lithuania
-
 Luxembourg
-
 Madagascar
-
 Malaysia
-
 Malta
-
 Mauritius
-
 Mexico
-
 Moldova
-
 Mongolia
-
 Montenegro
-
 Morocco
-
 Mozambique
-
 Myanmar
-
 Namibia
-
 Nepal
-
 Netherlands
-
 New Zealand
-
 Nigeria
-
 North Macedonia
-
 Norway
-
 Oman
-
 Pakistan
-
 Palestine
-
 Panama
-
 Papua New Guinea
-
 Paraguay
-
 Peru
-
 Philippines
-
 Poland
-
 Portugal
-
 Puerto Rico
-
 Qatar
-
 Reunion
-
 Romania
-
 Rwanda
-
 Saudi Arabia
-
 Serbia
-
 Singapore
-
 Slovakia
-
 Slovenia
-
 Somalia
-
 South Africa
-
 Spain
-
 Sri Lanka
-
 Sweden
-
 Switzerland
-
 Syria
-
 Taiwan
-
 Tajikistan
-
 Tanzania
-
 Thailand
-
 Trinidad and Tobago
-
 Tunisia
-
 Turkey
-
 UAE
-
 Uganda
-
 Ukraine
-
 United Kingdom
-
United States
-
 Uruguay
-
 Uzbekistan
-
 Venezuela
-
 Vietnam
-
 Yemen
-
 Zambia
-
 Zimbabwe
- Forex
- Crypto












