

Aviva stock forecast: Upward price move signals bullish momentum persists

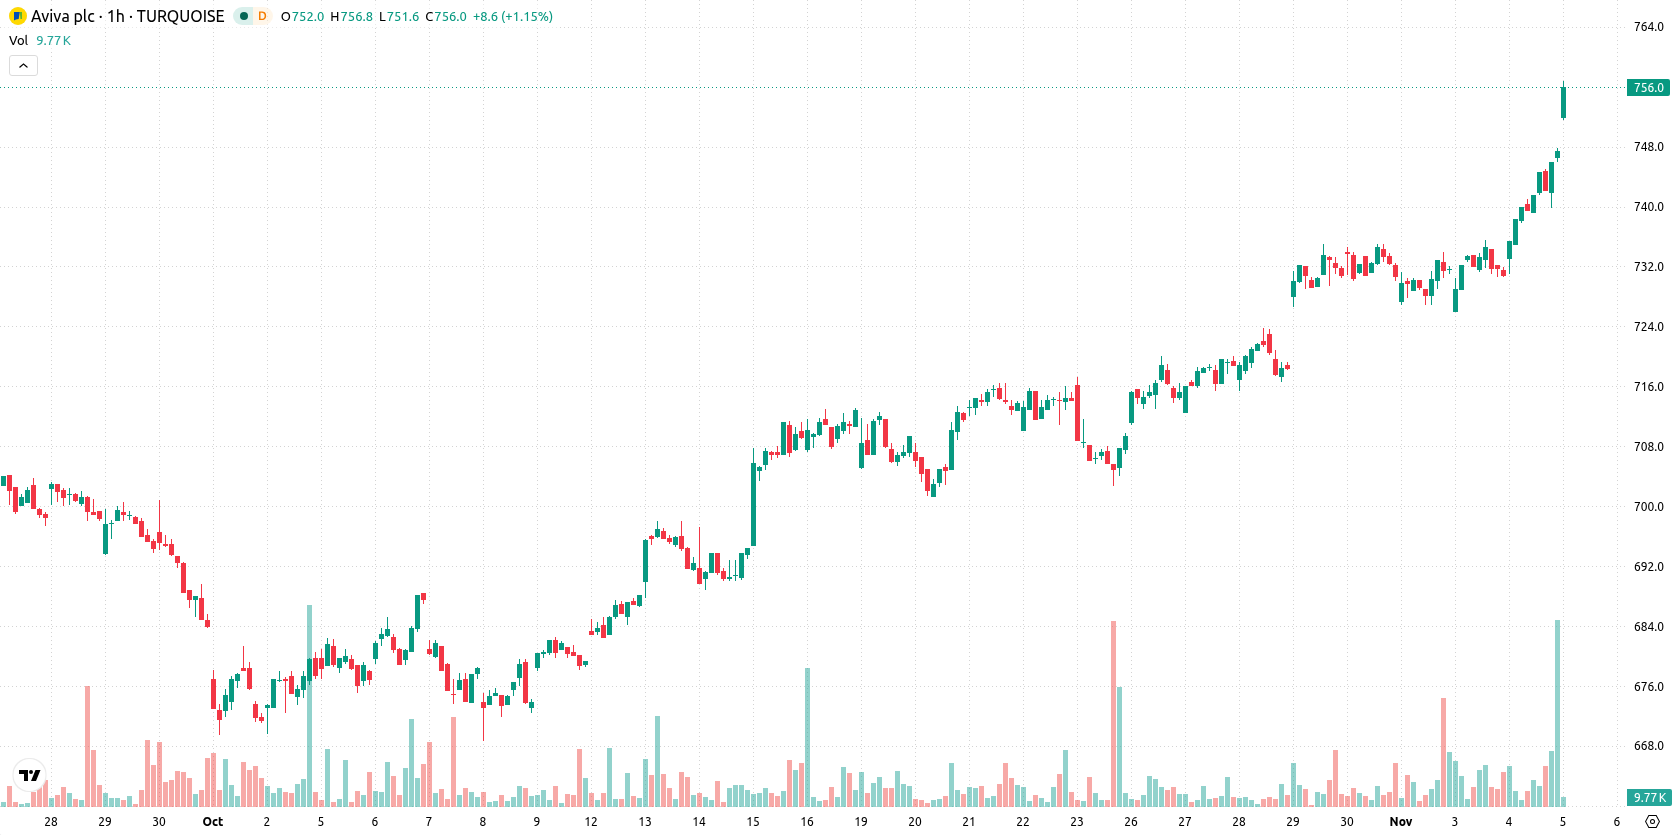
Aviva (AV) stock is trading at GBX757, reflecting a daily move up of 1.26%. The price sits above its key moving averages on the current timeframe, maintaining a position near the session high with low volatility so far today.
 752.20
768.60
Highlights
- Aviva acquired Direct Line in 2025, significantly expanding its market share and expected overhead savings for long-term growth.
- Shares of Aviva have seen an average annual dividend increase of 8% since 2022, with ongoing share buybacks planned.
- Aviva stock trades in a bullish trend with a projected range of GBX746.62 to GBX767.38 and short-term overbought indicators.
Market share expansion and dividend growth as capital management intensifies
Aviva's recent acquisition of Direct Line in 2025 marks a significant expansion of its market share and is expected to drive substantial overhead savings, according to Yahoo Finance. This strategic move enhances operational scale and strengthens the group's positioning for long-term growth. Alongside this, Aviva has delivered an average annual dividend increase of 8% since 2022 and affirmed its intention to provide regular and sustainable capital returns, including share buybacks. These combined initiatives underscore robust capital management and offer multiple avenues for shareholder value creation.
Bullish momentum prevails as technical signals hint short-term risk
On the technical front, AV is trading above the MA-20 and MA-50 on the working timeframe and well above the MA-200 on the daily chart. The Ichimoku Kijun level is positioned at GBX736.2, serving as immediate support. MACD and ADX both indicate bullish momentum, while Bull/Bear Power is strong at 7.27, and the Awesome Oscillator confirms the prevailing bullish tone. RSI stands neutral; however, Stoch RSI and CCI are both in the overbought zone, suggesting potential for a short-term pullback or consolidation despite the directional strength.
Consolidation likely as volatility range caps immediate breakout potential
In the short term, AV is expected to trade within the GBX746.62 to GBX767.38 range, reflecting the prevailing volatility band relative to current levels. There is a 79% probability of an upward move, with a 21% chance of a downward retracement scenario. The baseline scenario anticipates sideways consolidation within this range, while a break above the upper boundary could signal further gains. Conversely, a fall below the Ichimoku Kijun support may open the door to a deeper short-term correction.
Earlier, analysts noted that Aviva's technical setup reflected persistent bullish momentum within a well-defined consolidation range. The current outlook strengthens this view, highlighting a sideways trading scenario in the near term with a key focus on a potential breakout above GBX767.38 for renewed directional movement.









-
 Afghanistan
-
 Albania
-
 Algeria
-
 Angola
-
 Argentina
-
 Armenia
-
 Australia
-
 Austria
-
 Azerbaijan
-
 Bahamas
-
 Bahrain
-
 Bangladesh
-
 Belarus
-
 Belgium
-
 Bolivia
-
 Botswana
-
 Brazil
-
 Brunei
-
 Bulgaria
-
 Cambodia
-
 Cameroon
-
 Canada
-
 Chile
-
 China
-
 Colombia
-
 Congo
-
 Costa Rica
-
 Cote d'Ivoire
-
 Croatia
-
 Cuba
-
 Cyprus
-
 Czechia
-
 DR Congo
-
 Denmark
-
 Dominican Republic
-
 Ecuador
-
 Egypt
-
 El Salvador
-
 Estonia
-
 Eswatini
-
 Ethiopia
-
 Finland
-
 France
-
 Georgia
-
 Germany
-
 Ghana
-
 Greece
-
 Haiti
-
 Hong Kong
-
 Hungary
-
 India
-
 Indonesia
-
 Iran, Islamic republic
-
 Iraq
-
 Ireland
-
 Israel
-
 Italy
-
 Jamaica
-
 Japan
-
 Jordan
-
 Kazakhstan
-
 Kenya
-
 Korea
-
 Kuwait
-
 Kyrgyzstan
-
 Laos
-
 Latvia
-
 Lebanon
-
 Lesotho
-
 Libya
-
 Lithuania
-
 Luxembourg
-
 Madagascar
-
 Malaysia
-
 Malta
-
 Mauritius
-
 Mexico
-
 Moldova
-
 Mongolia
-
 Montenegro
-
 Morocco
-
 Mozambique
-
 Myanmar
-
 Namibia
-
 Nepal
-
 Netherlands
-
 New Zealand
-
 Nigeria
-
 North Macedonia
-
 Norway
-
 Oman
-
 Pakistan
-
 Palestine
-
 Panama
-
 Papua New Guinea
-
 Paraguay
-
 Peru
-
 Philippines
-
 Poland
-
 Portugal
-
 Puerto Rico
-
 Qatar
-
 Reunion
-
 Romania
-
 Rwanda
-
 Saudi Arabia
-
 Serbia
-
 Singapore
-
 Slovakia
-
 Slovenia
-
 Somalia
-
 South Africa
-
 Spain
-
 Sri Lanka
-
 Sweden
-
 Switzerland
-
 Syria
-
 Taiwan
-
 Tajikistan
-
 Tanzania
-
 Thailand
-
 Trinidad and Tobago
-
 Tunisia
-
 Turkey
-
 UAE
-
 Uganda
-
 Ukraine
-
 United Kingdom
-
United States
-
 Uruguay
-
 Uzbekistan
-
 Venezuela
-
 Vietnam
-
 Yemen
-
 Zambia
-
 Zimbabwe
- Forex
- Crypto












