

Will Aviva stock sustain its gains amid consolidation near GBX750.3 support?

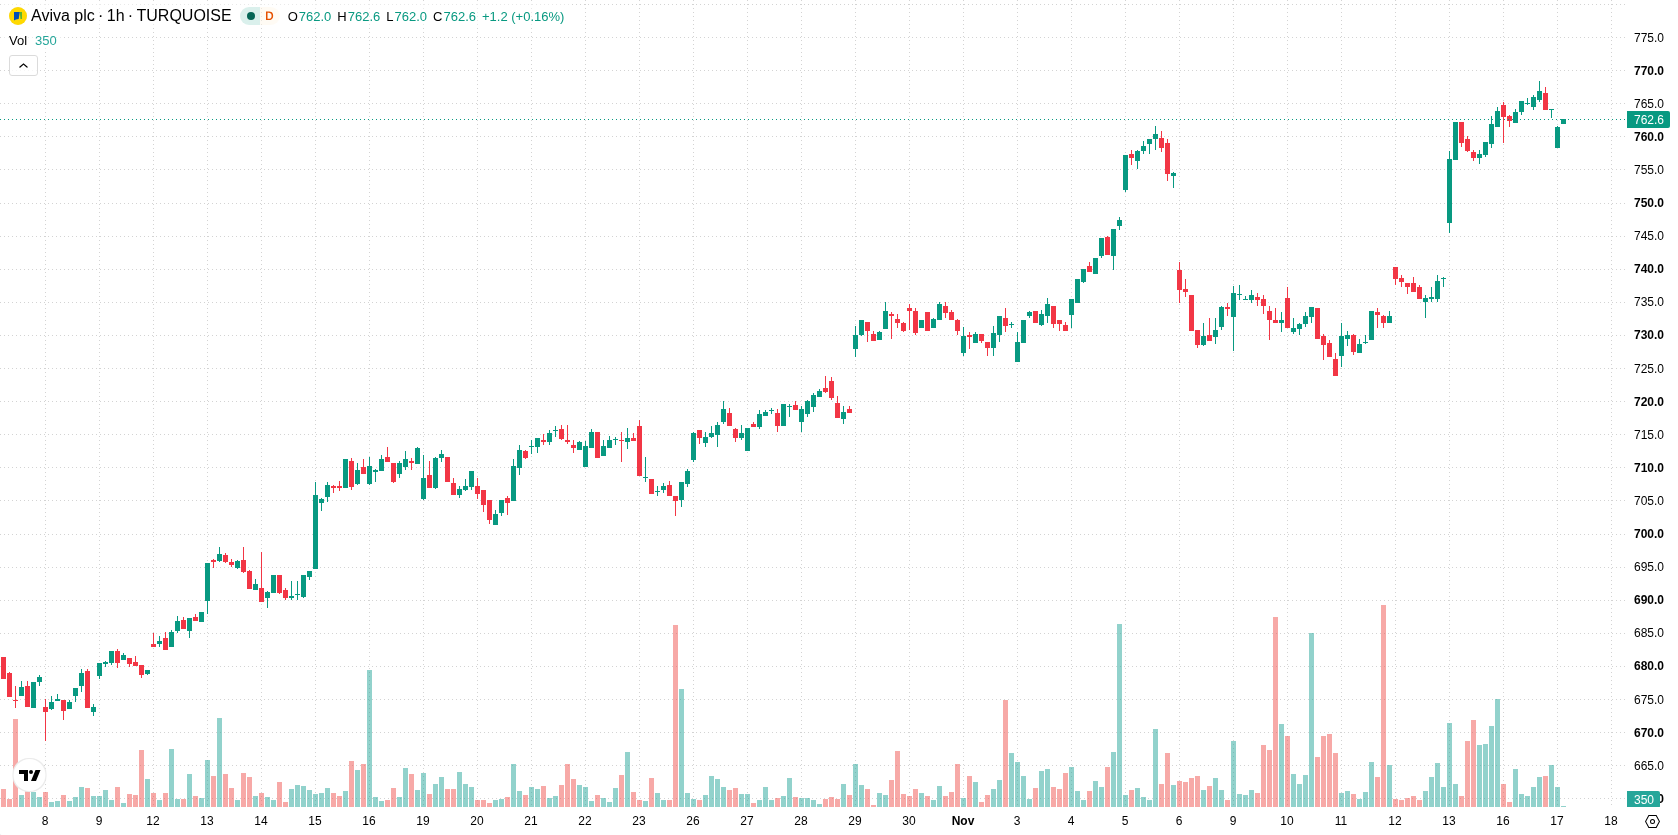
Aviva (AV) stock is trading at GBX764, posting a slight gain in today's session. The price is positioned above its key short-term, medium-term, and long-term moving averages, indicating continued price momentum relative to these benchmarks.
 764.40
768.20
Highlights
- Aviva reduced its direct stake in Rosebank Industries below 3%, now holding 2.95% directly and 0.85% in financial instruments.
- Aviva's combined voting rights in Rosebank Industries decreased slightly to 3.8% from the previous 3.85%.
- Rosebank Industries stock maintains a bullish technical structure with strong buy signals, expected to trade between GBX745.4 and GBX782.6 over the next 2 to 3 days.
Equity stake reduction highlights shift in capital allocation
On November 13, 2026, Aviva reduced its direct stake in Rosebank Industries PLC below the 3% disclosure threshold, now holding 2.95% directly alongside a further 0.85% via financial instruments, according to Investegate Co. This adjustment resulted in a slight decrease in Aviva's combined voting rights to 3.80%, down from the previous 3.85%. Such a change in equity exposure reflects ongoing capital strategies and may influence investor interpretations of Aviva’s portfolio management priorities.
Mixed momentum signals alongside strong technical support zone
AV is trading above the H1 SMA-20 at GBX760.8, the H1 SMA-50 at GBX743.78, and the D1 SMA-200 at GBX666.81. Immediate support is located at the Ichimoku Kijun on the hourly chart at GBX750.3. Momentum indicators present a complex picture: MACD is in strong buy mode, ADX signals a buy, while RSI and CCI are both neutral. Stochastic RSI is in the oversold zone, suggesting some near-term rebound potential, but without a confirmed reversal signal. Bull/Bear Power is marginally negative, indicating slight intraday seller presence, and the Awesome Oscillator is neutral.
High probability for consolidation amid balanced breakout risks
Over the next two to three days, AV is likely to trade within a typical volatility band between GBX745.4 and GBX782.6. There is a 71% probability of an upward move, while the chance of a downward move is 29%. The baseline scenario is further consolidation within this established range; a breakout above GBX782.6 would open the way for additional gains, while a breach below GBX745.4 may trigger additional weakness.
Earlier, analysts noted that Aviva's stock was supported by constructive technical setups and expected to remain in a period of sideways consolidation. The latest developments, including the adjustment in Aviva’s equity exposure and continued momentum above key moving averages, add a new dimension to the outlook, with traders advised to monitor the established volatility band between GBX745.4 and GBX782.6 for potential breakout or breakdown signals.









-
 Afghanistan
-
 Albania
-
 Algeria
-
 Angola
-
 Argentina
-
 Armenia
-
 Australia
-
 Austria
-
 Azerbaijan
-
 Bahamas
-
 Bahrain
-
 Bangladesh
-
 Belarus
-
 Belgium
-
 Bolivia
-
 Botswana
-
 Brazil
-
 Brunei
-
 Bulgaria
-
 Cambodia
-
 Cameroon
-
 Canada
-
 Chile
-
 China
-
 Colombia
-
 Congo
-
 Costa Rica
-
 Cote d'Ivoire
-
 Croatia
-
 Cuba
-
 Cyprus
-
 Czechia
-
 DR Congo
-
 Denmark
-
 Dominican Republic
-
 Ecuador
-
 Egypt
-
 El Salvador
-
 Estonia
-
 Eswatini
-
 Ethiopia
-
 Finland
-
 France
-
 Georgia
-
 Germany
-
 Ghana
-
 Greece
-
 Haiti
-
 Hong Kong
-
 Hungary
-
 India
-
 Indonesia
-
 Iran, Islamic republic
-
 Iraq
-
 Ireland
-
 Israel
-
 Italy
-
 Jamaica
-
 Japan
-
 Jordan
-
 Kazakhstan
-
 Kenya
-
 Korea
-
 Kuwait
-
 Kyrgyzstan
-
 Laos
-
 Latvia
-
 Lebanon
-
 Lesotho
-
 Libya
-
 Lithuania
-
 Luxembourg
-
 Madagascar
-
 Malaysia
-
 Malta
-
 Mauritius
-
 Mexico
-
 Moldova
-
 Mongolia
-
 Montenegro
-
 Morocco
-
 Mozambique
-
 Myanmar
-
 Namibia
-
 Nepal
-
 Netherlands
-
 New Zealand
-
 Nigeria
-
 North Macedonia
-
 Norway
-
 Oman
-
 Pakistan
-
 Palestine
-
 Panama
-
 Papua New Guinea
-
 Paraguay
-
 Peru
-
 Philippines
-
 Poland
-
 Portugal
-
 Puerto Rico
-
 Qatar
-
 Reunion
-
 Romania
-
 Rwanda
-
 Saudi Arabia
-
 Serbia
-
 Singapore
-
 Slovakia
-
 Slovenia
-
 Somalia
-
 South Africa
-
 Spain
-
 Sri Lanka
-
 Sweden
-
 Switzerland
-
 Syria
-
 Taiwan
-
 Tajikistan
-
 Tanzania
-
 Thailand
-
 Trinidad and Tobago
-
 Tunisia
-
 Turkey
-
 UAE
-
 Uganda
-
 Ukraine
-
 United Kingdom
-
United States
-
 Uruguay
-
 Uzbekistan
-
 Venezuela
-
 Vietnam
-
 Yemen
-
 Zambia
-
 Zimbabwe
- Forex
- Crypto












