

What's behind Halliburton's latest 5.3% stock pullback?

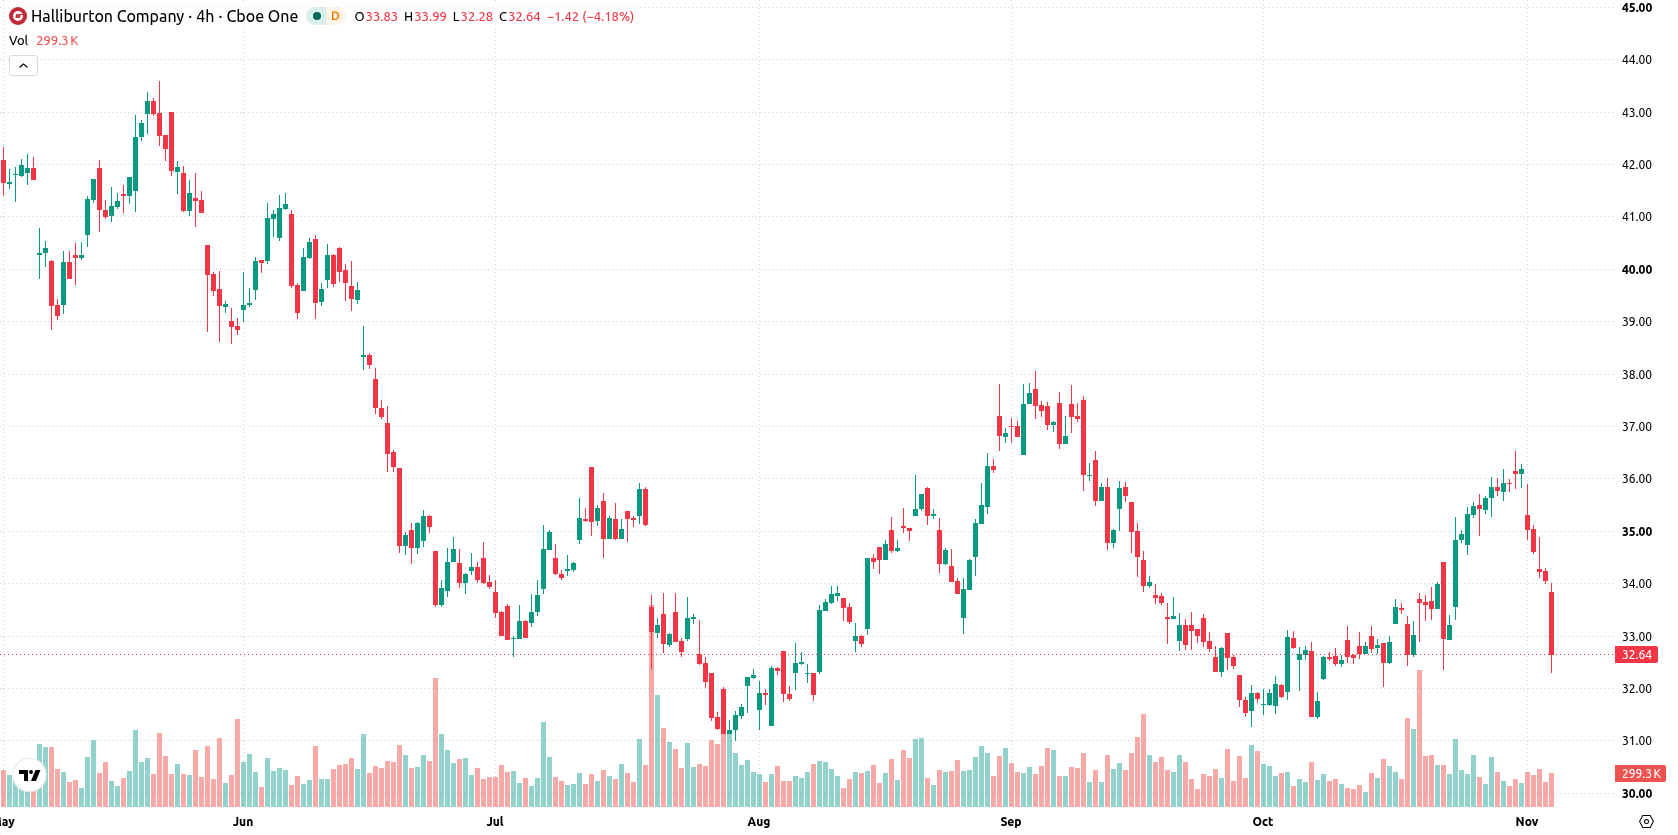
Halliburton Company (HAL) dropped 5.25% following reports that several institutional investors reduced their holdings during the third quarter, even as the firm continued to return cash to shareholders and launch new products. Selling momentum is broadly supported, with the stock holding below its key moving averages and technical signals confirming sustained pressure.
 33.14
33.78
Highlights
- Halliburton introduced Agile Asset Management, an AI-based cloud tool developed with Aker BP to support oil and gas project optimization.
- Third quarter revenue reached about $5.7 billion with a quarterly dividend of $0.17 per share as several institutional investors reduced holdings and share buybacks continued.
- Shares of Halliburton continue to trade under sustained downward momentum, with the price expected to move between $31.02 and $33.54 over the next five days and a 68% probability of further declines.
Product launches and buybacks overshadowed by persistent investment outflows
Halliburton launched Agile Asset Management, an AI-powered, cloud-based tool co-developed with Aker BP to help oil and gas companies optimize development decisions. The company reported third quarter revenue of approximately $5.7 billion and issued a quarterly dividend of $0.17 per share. Multiple institutional investors, including Heritage Investors Management Corp., Soltis Investment Advisors LLC, Sumitomo Mitsui Trust Group Inc., and Park Avenue Securities LLC, reported reductions in their holdings during this quarter. The period also saw ongoing share repurchases, though price action has remained under broader selling pressure.
Bearish trend persists as moving averages and momentum gauges stay subdued
HAL trades below its 20-day ($33.89), 50-day ($34.24), and 200-day ($35.86) moving averages, indicating consistent downward pressure across all timeframes. The immediate resistance is $32.83, with support at $31.02. The 50-day and 200-day moving average alignment points to a bearish trend. Among momentum indicators, the MACD shows a mild buy signal, but the ADX at 14.5 signals a weak trend. Both RSI and CCI are neutral, while the Stochastic RSI is in the oversold zone, indicating potential selling exhaustion. The Bull/Bear Power offers buyers a slight edge intraday. The price remains near session lows and daily volatility is elevated at 3.59%. Intraday signals and daily trend both reflect ongoing selling pressure.
Previously it was reported that Halliburton's upside was constrained by long-term technical resistance despite strength in international operations. The latest decline, alongside institutional selling and continued downward pressure across all major moving averages, puts the focus on whether the $31.02 support can hold as a pivotal level for near-term price stability.






Latest Halliburton Company News





-
 Afghanistan
-
 Albania
-
 Algeria
-
 Angola
-
 Argentina
-
 Armenia
-
 Australia
-
 Austria
-
 Azerbaijan
-
 Bahamas
-
 Bahrain
-
 Bangladesh
-
 Belarus
-
 Belgium
-
 Bolivia
-
 Botswana
-
 Brazil
-
 Brunei
-
 Bulgaria
-
 Cambodia
-
 Cameroon
-
 Canada
-
 Chile
-
 China
-
 Colombia
-
 Congo
-
 Costa Rica
-
 Cote d'Ivoire
-
 Croatia
-
 Cuba
-
 Cyprus
-
 Czechia
-
 DR Congo
-
 Denmark
-
 Dominican Republic
-
 Ecuador
-
 Egypt
-
 El Salvador
-
 Estonia
-
 Eswatini
-
 Ethiopia
-
 Finland
-
 France
-
 Georgia
-
 Germany
-
 Ghana
-
 Greece
-
 Haiti
-
 Hong Kong
-
 Hungary
-
 India
-
 Indonesia
-
 Iran, Islamic republic
-
 Iraq
-
 Ireland
-
 Israel
-
 Italy
-
 Jamaica
-
 Japan
-
 Jordan
-
 Kazakhstan
-
 Kenya
-
 Korea
-
 Kuwait
-
 Kyrgyzstan
-
 Laos
-
 Latvia
-
 Lebanon
-
 Lesotho
-
 Libya
-
 Lithuania
-
 Luxembourg
-
 Madagascar
-
 Malaysia
-
 Malta
-
 Mauritius
-
 Mexico
-
 Moldova
-
 Mongolia
-
 Montenegro
-
 Morocco
-
 Mozambique
-
 Myanmar
-
 Namibia
-
 Nepal
-
 Netherlands
-
 New Zealand
-
 Nigeria
-
 North Macedonia
-
 Norway
-
 Oman
-
 Pakistan
-
 Palestine
-
 Panama
-
 Papua New Guinea
-
 Paraguay
-
 Peru
-
 Philippines
-
 Poland
-
 Portugal
-
 Puerto Rico
-
 Qatar
-
 Reunion
-
 Romania
-
 Rwanda
-
 Saudi Arabia
-
 Serbia
-
 Singapore
-
 Slovakia
-
 Slovenia
-
 Somalia
-
 South Africa
-
 Spain
-
 Sri Lanka
-
 Sweden
-
 Switzerland
-
 Syria
-
 Taiwan
-
 Tajikistan
-
 Tanzania
-
 Thailand
-
 Trinidad and Tobago
-
 Tunisia
-
 Turkey
-
 UAE
-
 Uganda
-
 Ukraine
-
 United Kingdom
-
United States
-
 Uruguay
-
 Uzbekistan
-
 Venezuela
-
 Vietnam
-
 Yemen
-
 Zambia
-
 Zimbabwe
- Forex
- Crypto












