

What's behind Halliburton's latest 5.8% stock surge?

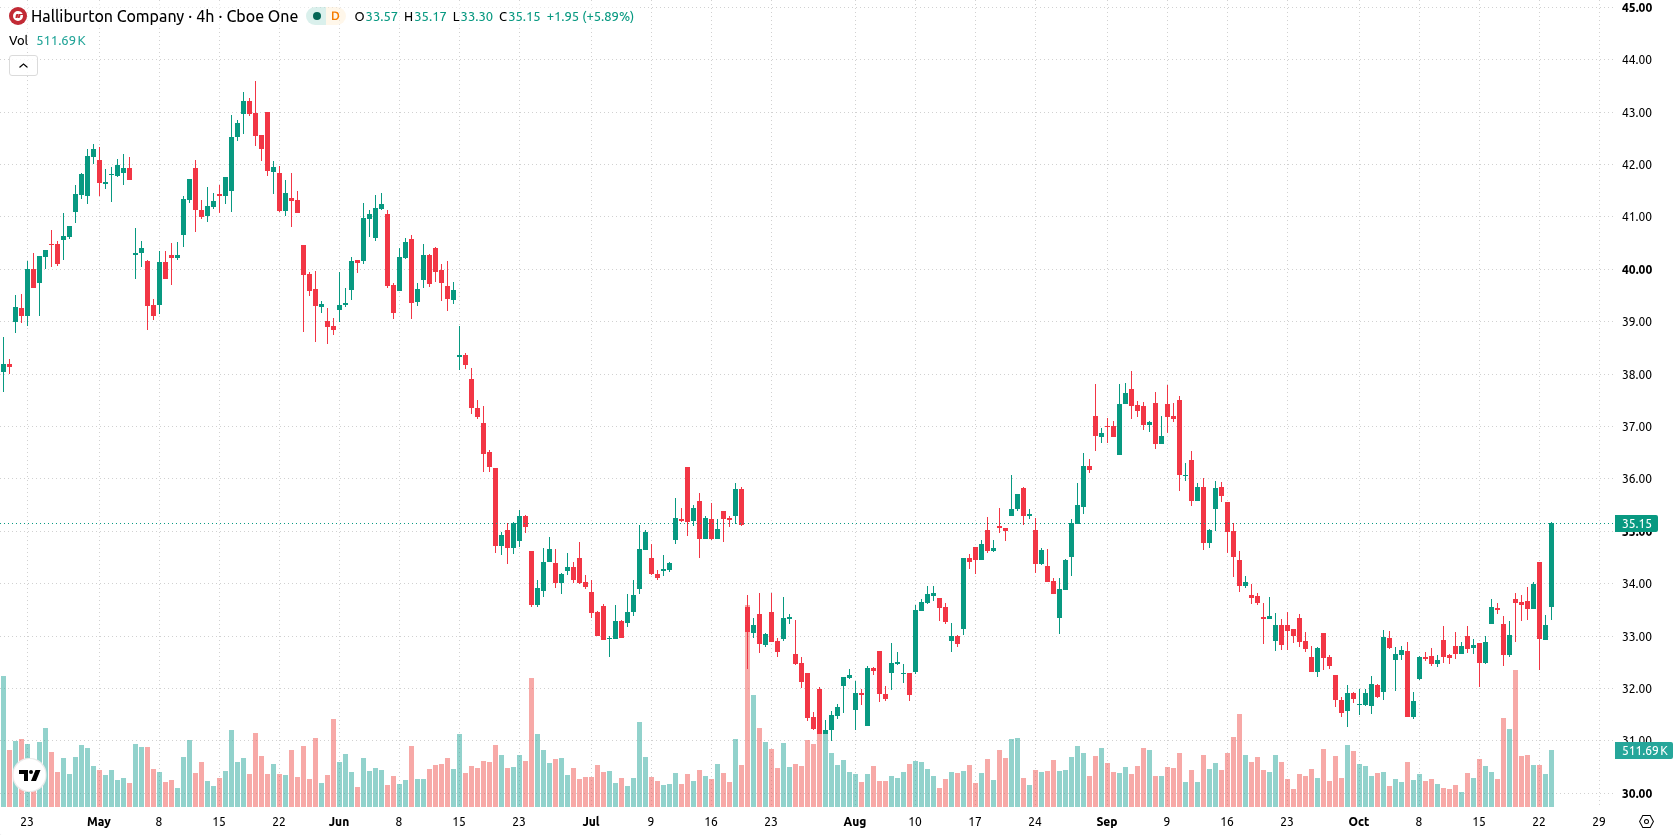
Halliburton Company (HAL) surged 5.83% after reporting third-quarter 2026 results driven by strong international revenue growth, even as weaker North American performance lingered in the earnings mix. The up move looks limited given that the price remains below the 200-day moving average, highlighting longer-term resistance.
 31.79
33.48
Highlights
- Halliburton reported third-quarter 2026 revenue of $5.7 billion with adjusted net income of $0.60 per diluted share and a 12.8% adjusted operating margin.
- International revenue increased 3% sequentially and 9% year over year, while North American revenue fell on reduced hydraulic fracturing demand and operational downtime.
- Shares of Halliburton are consolidating between $34.1 and $36.97, with technical indicators showing mixed momentum and a bearish bias for the coming sessions.
Mixed regional revenue and capital returns as management prioritizes margin stability
Halliburton reported third-quarter 2026 revenue of $5.7 billion with adjusted net income of $0.60 per diluted share and an adjusted operating margin of 12.8%. International revenue rose 3% sequentially and 9% year over year, while North American revenue declined due to reduced hydraulic fracturing demand and operational downtime from crew redeployments. The company continued share buybacks and dividends. Management expects ongoing cost savings and stable margins, with international growth remaining a key focus.
Short-term bullish momentum tempered by longer-term resistance and weak signals
Halliburton is trading above its 20-day ($32.65) and 50-day ($34.13) moving averages, indicating near-term and medium-term bullishness. The price remains just under the 200-day average ($35.74), signaling lingering longer-term resistance and a bearish alignment between the 50-day and 200-day moving averages. Near-term resistance is identified at $35.74 and support at $34.9, with the Ichimoku Kijun ($32.96) set well below current levels. Momentum readings are mixed: the Moving Average Convergence Divergence (MACD) is negative with a "Strong Sell" forecast, and the Average Directional Index (ADX) at 18.59 indicates a lack of clear directional strength. Short-term oscillators show the Relative Strength Index (RSI) at 49.37 with a "Sell" signal and the Stochastic RSI at 63.56 forecasting "Strong Sell". The Commodity Channel Index (CCI) and Bull/Bear Power (BBP) both indicate overbought conditions, with buyers still dominating intraday momentum. The stock is up $1.94 or 5.83% on the day following an upside gap of about $0.27 (0.81%), sitting near the high of its daily range. Intraday volatility stands at 4.80%, reflecting a strong tone toward the session highs, though momentum signals warn of potential exhaustion.
Previously it was reported that Halliburton’s upside was constrained by long-term resistance levels despite strength in international revenues offsetting North American weakness. The latest technicals and momentum readings highlight the importance of the $34.1 support level, as a breakdown here would confirm a downside scenario and shift the current consolidation toward lower price bands.






Latest Halliburton Company News




-
 Afghanistan
-
 Albania
-
 Algeria
-
 Angola
-
 Argentina
-
 Armenia
-
 Australia
-
 Austria
-
 Azerbaijan
-
 Bahamas
-
 Bahrain
-
 Bangladesh
-
 Belarus
-
 Belgium
-
 Bolivia
-
 Botswana
-
 Brazil
-
 Brunei
-
 Bulgaria
-
 Cambodia
-
 Cameroon
-
 Canada
-
 Chile
-
 China
-
 Colombia
-
 Congo
-
 Costa Rica
-
 Cote d'Ivoire
-
 Croatia
-
 Cuba
-
 Cyprus
-
 Czechia
-
 DR Congo
-
 Denmark
-
 Dominican Republic
-
 Ecuador
-
 Egypt
-
 El Salvador
-
 Estonia
-
 Eswatini
-
 Ethiopia
-
 Finland
-
 France
-
 Georgia
-
 Germany
-
 Ghana
-
 Greece
-
 Haiti
-
 Hong Kong
-
 Hungary
-
 India
-
 Indonesia
-
 Iran, Islamic republic
-
 Iraq
-
 Ireland
-
 Israel
-
 Italy
-
 Jamaica
-
 Japan
-
 Jordan
-
 Kazakhstan
-
 Kenya
-
 Korea
-
 Kuwait
-
 Kyrgyzstan
-
 Laos
-
 Latvia
-
 Lebanon
-
 Lesotho
-
 Libya
-
 Lithuania
-
 Luxembourg
-
 Madagascar
-
 Malaysia
-
 Malta
-
 Mauritius
-
 Mexico
-
 Moldova
-
 Mongolia
-
 Montenegro
-
 Morocco
-
 Mozambique
-
 Myanmar
-
 Namibia
-
 Nepal
-
 Netherlands
-
 New Zealand
-
 Nigeria
-
 North Macedonia
-
 Norway
-
 Oman
-
 Pakistan
-
 Palestine
-
 Panama
-
 Papua New Guinea
-
 Paraguay
-
 Peru
-
 Philippines
-
 Poland
-
 Portugal
-
 Puerto Rico
-
 Qatar
-
 Reunion
-
 Romania
-
 Rwanda
-
 Saudi Arabia
-
 Serbia
-
 Singapore
-
 Slovakia
-
 Slovenia
-
 Somalia
-
 South Africa
-
 Spain
-
 Sri Lanka
-
 Sweden
-
 Switzerland
-
 Syria
-
 Taiwan
-
 Tajikistan
-
 Tanzania
-
 Thailand
-
 Trinidad and Tobago
-
 Tunisia
-
 Turkey
-
 UAE
-
 Uganda
-
 Ukraine
-
 United Kingdom
-
United States
-
 Uruguay
-
 Uzbekistan
-
 Venezuela
-
 Vietnam
-
 Yemen
-
 Zambia
-
 Zimbabwe
- Forex
- Crypto












