


Halliburton Company (HAL) dropped 3.00% after reporting strong third-quarter results with revenue growth outside North America. The downside move looks limited, as technical structure indicates the stock stabilized above its 20-day moving average but remains capped by longer-term resistance levels.
 36.51
36.51
Highlights
- Halliburton reported third-quarter revenue of $5.703 billion and adjusted earnings of $0.60 per share, driven by international demand in the Middle East and Latin America.
- Contract wins in Saudi Arabia and reopening activity in Venezuela offset weak North American revenue from reduced hydraulic fracturing business.
- Shares of Halliburton last traded near $32.97, facing a 3% drop with technically overbought conditions and an expected range of $31.86 to $33.77 in the next five trading days.
International gains offset by U.S. weakness amid post-earnings selling
Halliburton Company reported strong third-quarter results, posting $5.703 billion in revenue and adjusted earnings of $0.60 per share. Growth was supported by international demand, most notably in the Middle East and Latin America, and operational progress was made with contract wins in Saudi Arabia and reopening activities in Venezuela. North American revenue fell due to softer hydraulic fracturing activity, and the company maintained its focus on international markets with ongoing shareholder returns through dividends and share buybacks. These developments were accompanied by broader selling pressure in the share price.
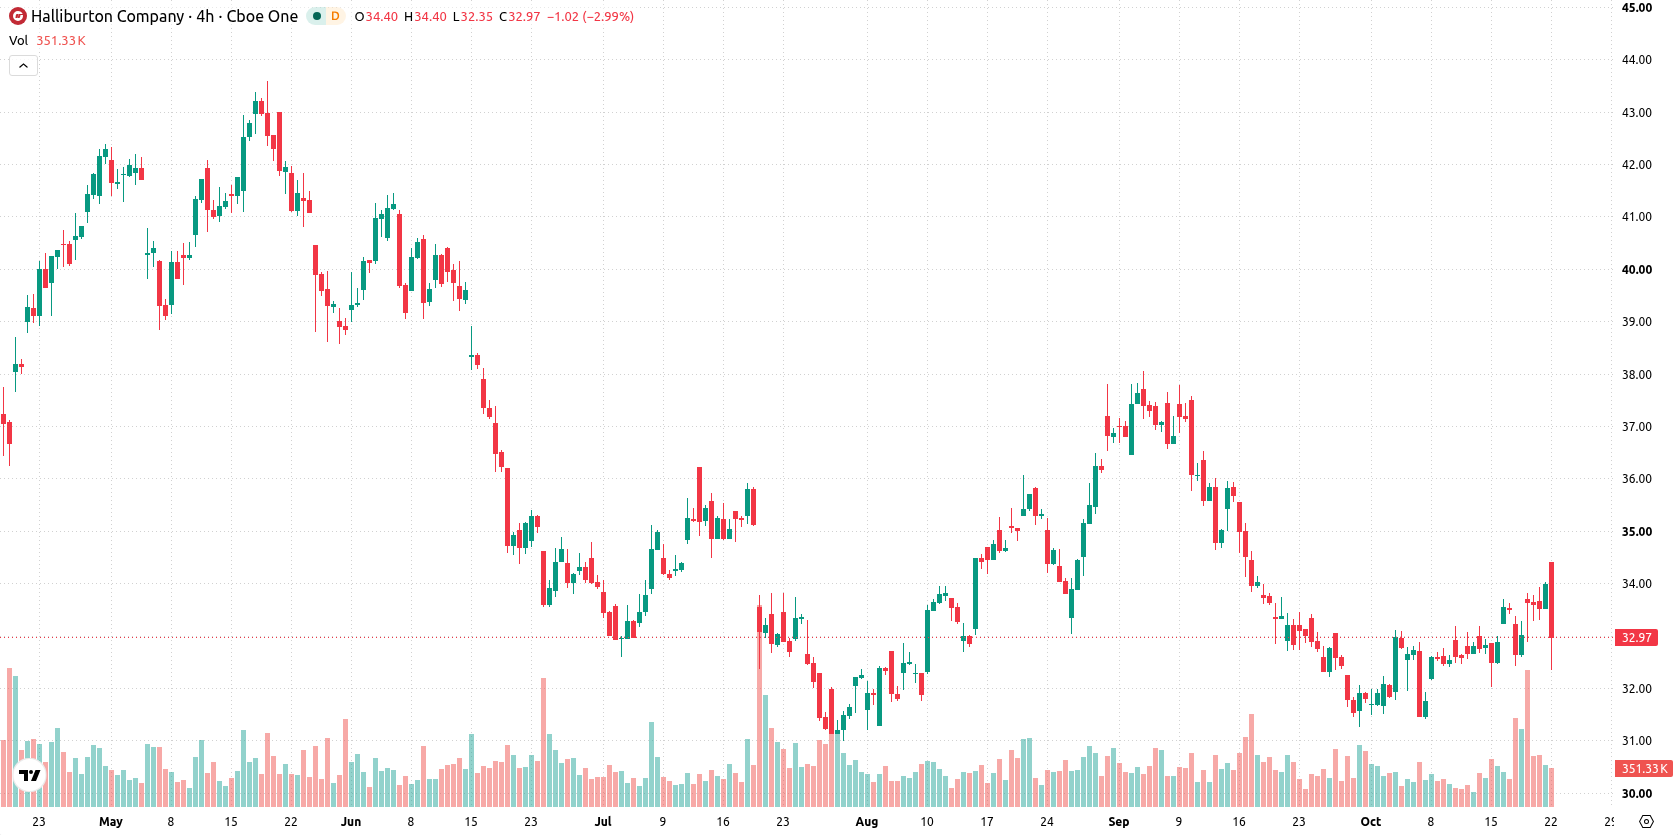
Mixed momentum clashes with overbought signals near short-term support
Halliburton is trading above its 20-day moving average at $32.63 but remains below the 50-day at $34.13 and the 200-day at $35.72. This configuration points to some short-term stabilization above near-term support, with broader medium- and long-term trends still reflecting pressure from sellers; the initial ceiling is identified at $33.44 as defined by the Ichimoku Kijun. Momentum signals present mixed readings: MACD is flagging strong sell conditions while the Average Directional Index (ADX) remains neutral, suggesting the ongoing trend is weak. The Relative Strength Index (RSI) is moderately bullish, but Stochastic RSI and Commodity Channel Index (CCI) both highlight pronounced overbought territory, a view supported by the Bull/Bear Power (BBP) value of 0.93—buyers are currently in control, yet this state is seen as overbought. The stock opened with an upside gap of about 0.91% and is last priced at $32.97, falling $1.02 or 3% today. Price action sits near the session low, with intraday volatility at 5.75%, indicating sharp pressure after the open, and this partially contradicts the overbought momentum readings.
Earlier, analysts noted that rising transport and insurance costs were reshaping energy market dynamics with shipping and risk premiums increasingly impacting the delivered cost of oil. Halliburton's latest results, which highlight robust international growth amid continued logistical and pricing pressures in global energy flows, suggest that monitoring the $32.63 technical floor is critical for gauging near-term downside risk.






Latest Halliburton Company News




-
 Afghanistan
-
 Albania
-
 Algeria
-
 Angola
-
 Argentina
-
 Armenia
-
 Australia
-
 Austria
-
 Azerbaijan
-
 Bahamas
-
 Bahrain
-
 Bangladesh
-
 Belarus
-
 Belgium
-
 Bolivia
-
 Botswana
-
 Brazil
-
 Brunei
-
 Bulgaria
-
 Cambodia
-
 Cameroon
-
 Canada
-
 Chile
-
 China
-
 Colombia
-
 Congo
-
 Costa Rica
-
 Cote d'Ivoire
-
 Croatia
-
 Cuba
-
 Cyprus
-
 Czechia
-
 DR Congo
-
 Denmark
-
 Dominican Republic
-
 Ecuador
-
 Egypt
-
 El Salvador
-
 Estonia
-
 Eswatini
-
 Ethiopia
-
 Finland
-
 France
-
 Georgia
-
 Germany
-
 Ghana
-
 Greece
-
 Haiti
-
 Hong Kong
-
 Hungary
-
 India
-
 Indonesia
-
 Iran, Islamic republic
-
 Iraq
-
 Ireland
-
 Israel
-
 Italy
-
 Jamaica
-
 Japan
-
 Jordan
-
 Kazakhstan
-
 Kenya
-
 Korea
-
 Kuwait
-
 Kyrgyzstan
-
 Laos
-
 Latvia
-
 Lebanon
-
 Lesotho
-
 Libya
-
 Lithuania
-
 Luxembourg
-
 Madagascar
-
 Malaysia
-
 Malta
-
 Mauritius
-
 Mexico
-
 Moldova
-
 Mongolia
-
 Montenegro
-
 Morocco
-
 Mozambique
-
 Myanmar
-
 Namibia
-
 Nepal
-
 Netherlands
-
 New Zealand
-
 Nigeria
-
 North Macedonia
-
 Norway
-
 Oman
-
 Pakistan
-
 Palestine
-
 Panama
-
 Papua New Guinea
-
 Paraguay
-
 Peru
-
 Philippines
-
 Poland
-
 Portugal
-
 Puerto Rico
-
 Qatar
-
 Reunion
-
 Romania
-
 Rwanda
-
 Saudi Arabia
-
 Serbia
-
 Singapore
-
 Slovakia
-
 Slovenia
-
 Somalia
-
 South Africa
-
 Spain
-
 Sri Lanka
-
 Sweden
-
 Switzerland
-
 Syria
-
 Taiwan
-
 Tajikistan
-
 Tanzania
-
 Thailand
-
 Trinidad and Tobago
-
 Tunisia
-
 Turkey
-
 UAE
-
 Uganda
-
 Ukraine
-
 United Kingdom
-
United States
-
 Uruguay
-
 Uzbekistan
-
 Venezuela
-
 Vietnam
-
 Yemen
-
 Zambia
-
 Zimbabwe
- Forex
- Crypto












