

TELUS shares technical analysis: Upward price move intact with C$13.18 resistance in focus

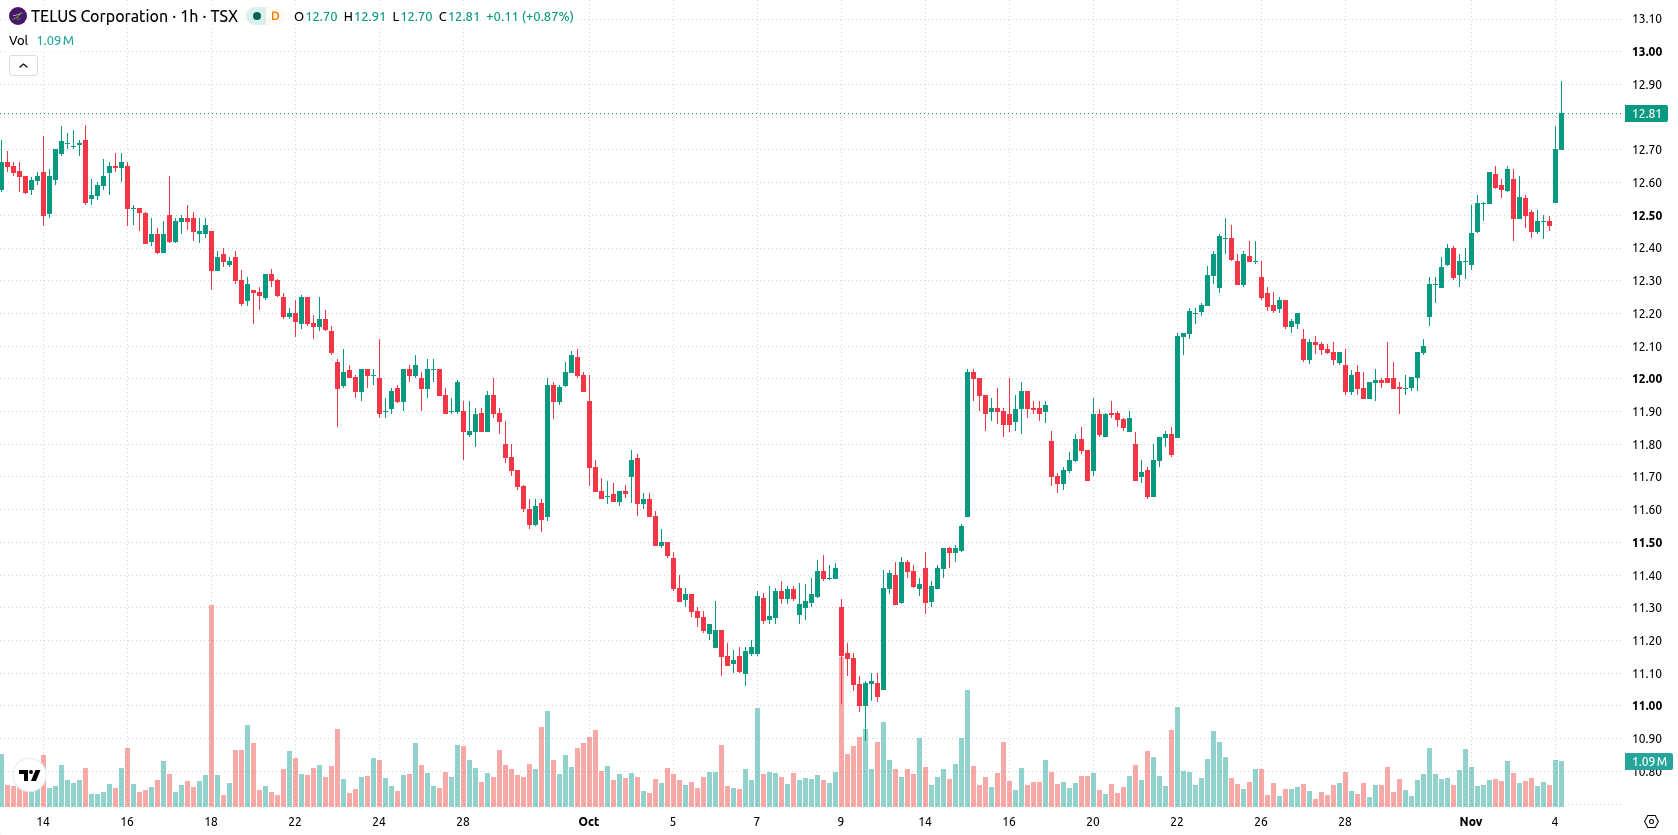
TELUS (T) stock is trading at C$12.84, gaining 2.97% on the day and closing near the top end of its intraday range with moderate volatility. The price currently sits above its short- and medium-term moving averages, while still remaining below longer-term benchmarks.
 13.25
13.25
Highlights
- TELUS stock saw robust trading activity with a combined value of CAD 147.03 million, indicating elevated liquidity and participation.
- Sustained investor engagement supported the ongoing upward momentum in the stock during the session.
- Technical indicators confirm a short- to medium-term bullish trend with strong buy momentum, projecting a trading range of CAD 12.50 to CAD 13.18 in the coming days.
Investor activity surges as elevated turnover boosts liquidity
TELUS Corporation experienced robust trading activity on November 3, 2026, registering a trading value of approximately CAD 84.71 million during the session, according to Kalkine. This elevated level of turnover indicates heightened investor participation and greater liquidity, which can facilitate sizable moves and improved price discovery in the stock. An additional trading-value measure of CAD 62.32 million on the same day further underscores sustained engagement from market participants, creating supportive conditions for the current upward momentum.
Mixed momentum as trend strength clashes with neutral oscillators
On the hourly chart, T is trading above the MA-20 and MA-50, while remaining below the long-term MA-200 at C$15.70. The Ichimoku Kijun level at C$12.27 provides immediate support. MACD is showing strong buy momentum and ADX confirms notable directional strength. RSI and CCI readings are neutral, while Stochastic RSI is oversold, pointing to potential for a near-term rebound. Intraday, Bull/Bear Power is slightly positive, highlighting mild buyer dominance, whereas the Awesome Oscillator remains neutral. There is a clear divergence between strong trend signals and the more tentative oscillator readings, flagging the possibility of a short-term corrective move even as intraday trend strength holds.
Upside scenario favored as resistance break could extend rally
Over the next several days, T is expected to consolidate within a typical volatility band of C$12.50 to C$13.18. There is a high probability of an upward extension, while the downside scenario is seen as unlikely. The baseline scenario involves continued range-bound trade in this corridor, with bullish momentum confirmed if the price breaks above C$13.18 resistance. The bearish scenario would only emerge on a sustained move below C$12.50 support.
Previously it was reported that TELUS's major dividend reduction aimed to improve operational flexibility and support the balance sheet as technical readings signaled mixed, range-bound momentum. The current analysis reinforces this outlook with evidence of strong trading activity and sustained liquidity, highlighting C$13.18 as the key level to monitor for confirmation of renewed bullish momentum.









-
 Afghanistan
-
 Albania
-
 Algeria
-
 Angola
-
 Argentina
-
 Armenia
-
 Australia
-
 Austria
-
 Azerbaijan
-
 Bahamas
-
 Bahrain
-
 Bangladesh
-
 Belarus
-
 Belgium
-
 Bolivia
-
 Botswana
-
 Brazil
-
 Brunei
-
 Bulgaria
-
 Cambodia
-
 Cameroon
-
 Canada
-
 Chile
-
 China
-
 Colombia
-
 Congo
-
 Costa Rica
-
 Cote d'Ivoire
-
 Croatia
-
 Cuba
-
 Cyprus
-
 Czechia
-
 DR Congo
-
 Denmark
-
 Dominican Republic
-
 Ecuador
-
 Egypt
-
 El Salvador
-
 Estonia
-
 Eswatini
-
 Ethiopia
-
 Finland
-
 France
-
 Georgia
-
 Germany
-
 Ghana
-
 Greece
-
 Haiti
-
 Hong Kong
-
 Hungary
-
 India
-
 Indonesia
-
 Iran, Islamic republic
-
 Iraq
-
 Ireland
-
 Israel
-
 Italy
-
 Jamaica
-
 Japan
-
 Jordan
-
 Kazakhstan
-
 Kenya
-
 Korea
-
 Kuwait
-
 Kyrgyzstan
-
 Laos
-
 Latvia
-
 Lebanon
-
 Lesotho
-
 Libya
-
 Lithuania
-
 Luxembourg
-
 Madagascar
-
 Malaysia
-
 Malta
-
 Mauritius
-
 Mexico
-
 Moldova
-
 Mongolia
-
 Montenegro
-
 Morocco
-
 Mozambique
-
 Myanmar
-
 Namibia
-
 Nepal
-
 Netherlands
-
 New Zealand
-
 Nigeria
-
 North Macedonia
-
 Norway
-
 Oman
-
 Pakistan
-
 Palestine
-
 Panama
-
 Papua New Guinea
-
 Paraguay
-
 Peru
-
 Philippines
-
 Poland
-
 Portugal
-
 Puerto Rico
-
 Qatar
-
 Reunion
-
 Romania
-
 Rwanda
-
 Saudi Arabia
-
 Serbia
-
 Singapore
-
 Slovakia
-
 Slovenia
-
 Somalia
-
 South Africa
-
 Spain
-
 Sri Lanka
-
 Sweden
-
 Switzerland
-
 Syria
-
 Taiwan
-
 Tajikistan
-
 Tanzania
-
 Thailand
-
 Trinidad and Tobago
-
 Tunisia
-
 Turkey
-
 UAE
-
 Uganda
-
 Ukraine
-
 United Kingdom
-
United States
-
 Uruguay
-
 Uzbekistan
-
 Venezuela
-
 Vietnam
-
 Yemen
-
 Zambia
-
 Zimbabwe
- Forex
- Crypto












