

S&P 500 rises around 1.5% as strong Q3 earnings and Okta inclusion fuel rally

S&P 500 Index (SPX) climbed 1.47% as stronger-than-expected Q3 2026 year-over-year earnings growth fueled renewed buying interest, with ETF and fund flows adjusting after Okta joined the index. The move is limited by the fact that SPX remains below its 20- and 50-day moving averages, signaling ongoing pressure despite the rally.
 7621.78
7652.76
Highlights
- S&P 500 reported 30.2% year-over-year earnings growth for Q3 2026, exceeding estimates and setting new forward earnings per share highs.
- Okta was included in the index, triggering ETF and fund rebalancing to accommodate the new constituent.
- Index is trading below key short- and medium-term averages, with mixed momentum readings and a projected five-session range of 7,578 to 7,782.
Fund flows shift on Okta addition as sentiment weighs policy risks
The S&P 500 reported 30.2% year-over-year earnings growth for Q3 2026, beating the estimated 29.1% and reaching new highs in forward 12-month earnings per share. In October 2026, the index moved above and then below its mean trendline for trailing-year dividends per share, remaining within typical volatility bands. Okta was added to the index, prompting ETF and fund rebalancing to account for its inclusion. Historical patterns around post-election performance and the influence of Treasury yields, inflation risks, and policy uncertainty were also under review.
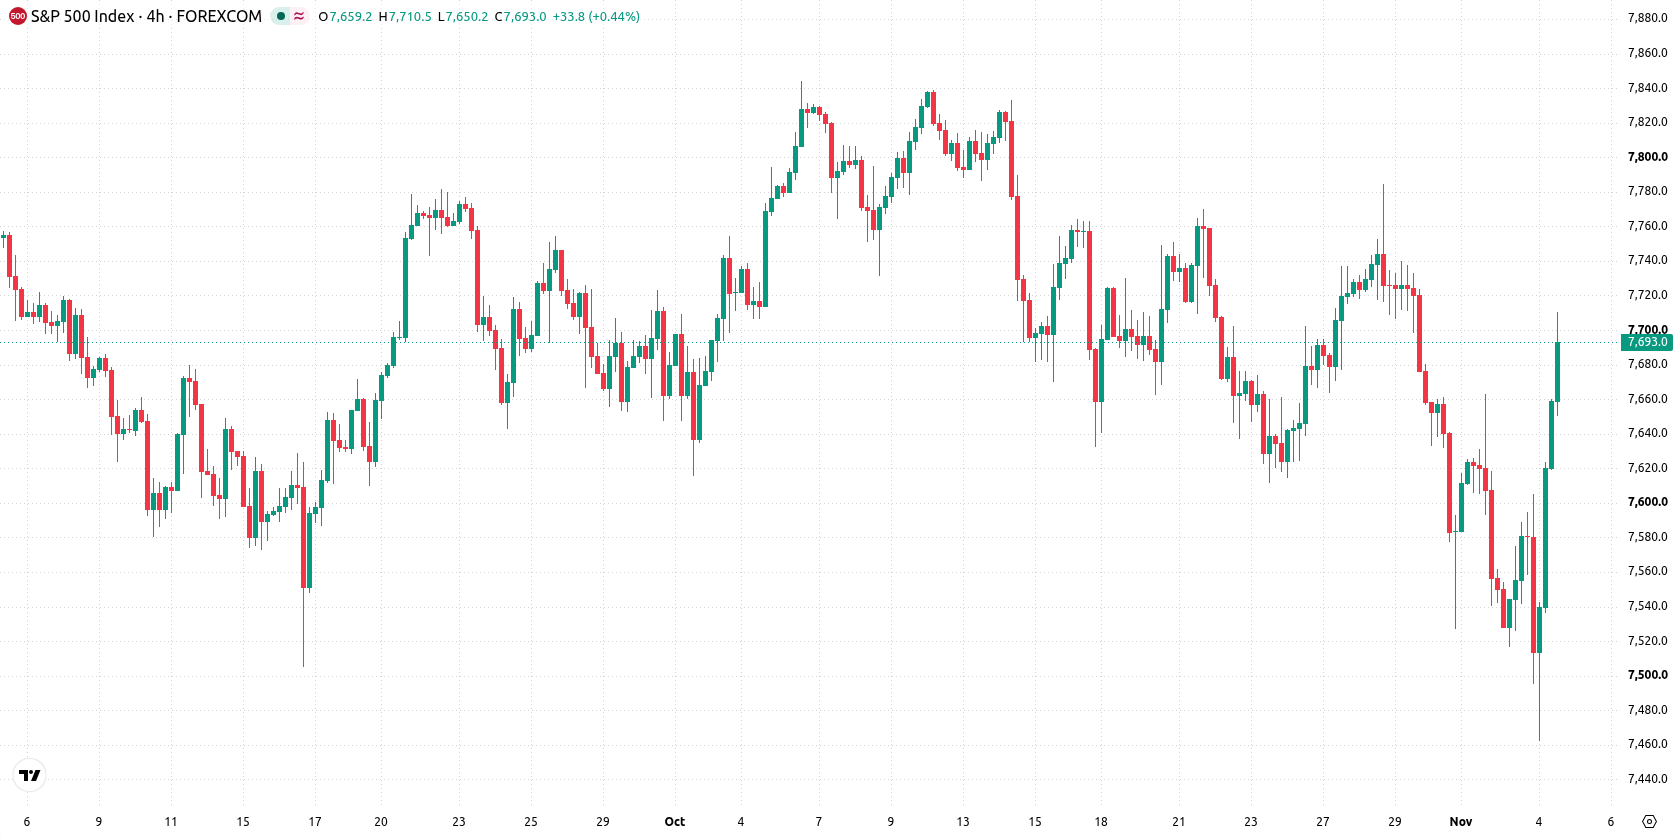
Sellers control intraday momentum as price tests key supports
SPX is trading below both its 20-day (7,704) and 50-day (7,692) moving averages, indicating persistent short- and medium-term pressure from sellers, but remains above its 200-day moving average (7,315), which confirms a longer-term bullish structure. The nearest resistance is the Ichimoku Kijun at 7,685, while immediate support lies at the session low of 7,635. Momentum readings are mixed: RSI is neutral, while the Stochastic RSI and CCI are oversold. Sellers dominate intraday momentum, evidenced by negative Bull/Bear Power, with both MACD and Awesome Oscillator signaling a sell bias. Intraday volatility stands at 0.97%, with the price sitting mid-range during the session.
Earlier, analysts noted that the S&P 500 was showing mixed momentum signals as it traded in a range defined by volatility and key technical levels. The current analysis adds a fresh dimension by highlighting the role of post-earnings fund flows and recent index rebalancing, with close attention warranted on whether SPX can decisively reclaim resistance at 7,685 to break out of its prevailing range.










-
 Afghanistan
-
 Albania
-
 Algeria
-
 Angola
-
 Argentina
-
 Armenia
-
 Australia
-
 Austria
-
 Azerbaijan
-
 Bahamas
-
 Bahrain
-
 Bangladesh
-
 Belarus
-
 Belgium
-
 Bolivia
-
 Botswana
-
 Brazil
-
 Brunei
-
 Bulgaria
-
 Cambodia
-
 Cameroon
-
 Canada
-
 Chile
-
 China
-
 Colombia
-
 Congo
-
 Costa Rica
-
 Cote d'Ivoire
-
 Croatia
-
 Cuba
-
 Cyprus
-
 Czechia
-
 DR Congo
-
 Denmark
-
 Dominican Republic
-
 Ecuador
-
 Egypt
-
 El Salvador
-
 Estonia
-
 Eswatini
-
 Ethiopia
-
 Finland
-
 France
-
 Georgia
-
 Germany
-
 Ghana
-
 Greece
-
 Haiti
-
 Hong Kong
-
 Hungary
-
 India
-
 Indonesia
-
 Iran, Islamic republic
-
 Iraq
-
 Ireland
-
 Israel
-
 Italy
-
 Jamaica
-
 Japan
-
 Jordan
-
 Kazakhstan
-
 Kenya
-
 Korea
-
 Kuwait
-
 Kyrgyzstan
-
 Laos
-
 Latvia
-
 Lebanon
-
 Lesotho
-
 Libya
-
 Lithuania
-
 Luxembourg
-
 Madagascar
-
 Malaysia
-
 Malta
-
 Mauritius
-
 Mexico
-
 Moldova
-
 Mongolia
-
 Montenegro
-
 Morocco
-
 Mozambique
-
 Myanmar
-
 Namibia
-
 Nepal
-
 Netherlands
-
 New Zealand
-
 Nigeria
-
 North Macedonia
-
 Norway
-
 Oman
-
 Pakistan
-
 Palestine
-
 Panama
-
 Papua New Guinea
-
 Paraguay
-
 Peru
-
 Philippines
-
 Poland
-
 Portugal
-
 Puerto Rico
-
 Qatar
-
 Reunion
-
 Romania
-
 Rwanda
-
 Saudi Arabia
-
 Serbia
-
 Singapore
-
 Slovakia
-
 Slovenia
-
 Somalia
-
 South Africa
-
 Spain
-
 Sri Lanka
-
 Sweden
-
 Switzerland
-
 Syria
-
 Taiwan
-
 Tajikistan
-
 Tanzania
-
 Thailand
-
 Trinidad and Tobago
-
 Tunisia
-
 Turkey
-
 UAE
-
 Uganda
-
 Ukraine
-
 United Kingdom
-
United States
-
 Uruguay
-
 Uzbekistan
-
 Venezuela
-
 Vietnam
-
 Yemen
-
 Zambia
-
 Zimbabwe
- Forex
- Crypto












