

ETF inflows support S&P 500 index as weak momentum signals persist

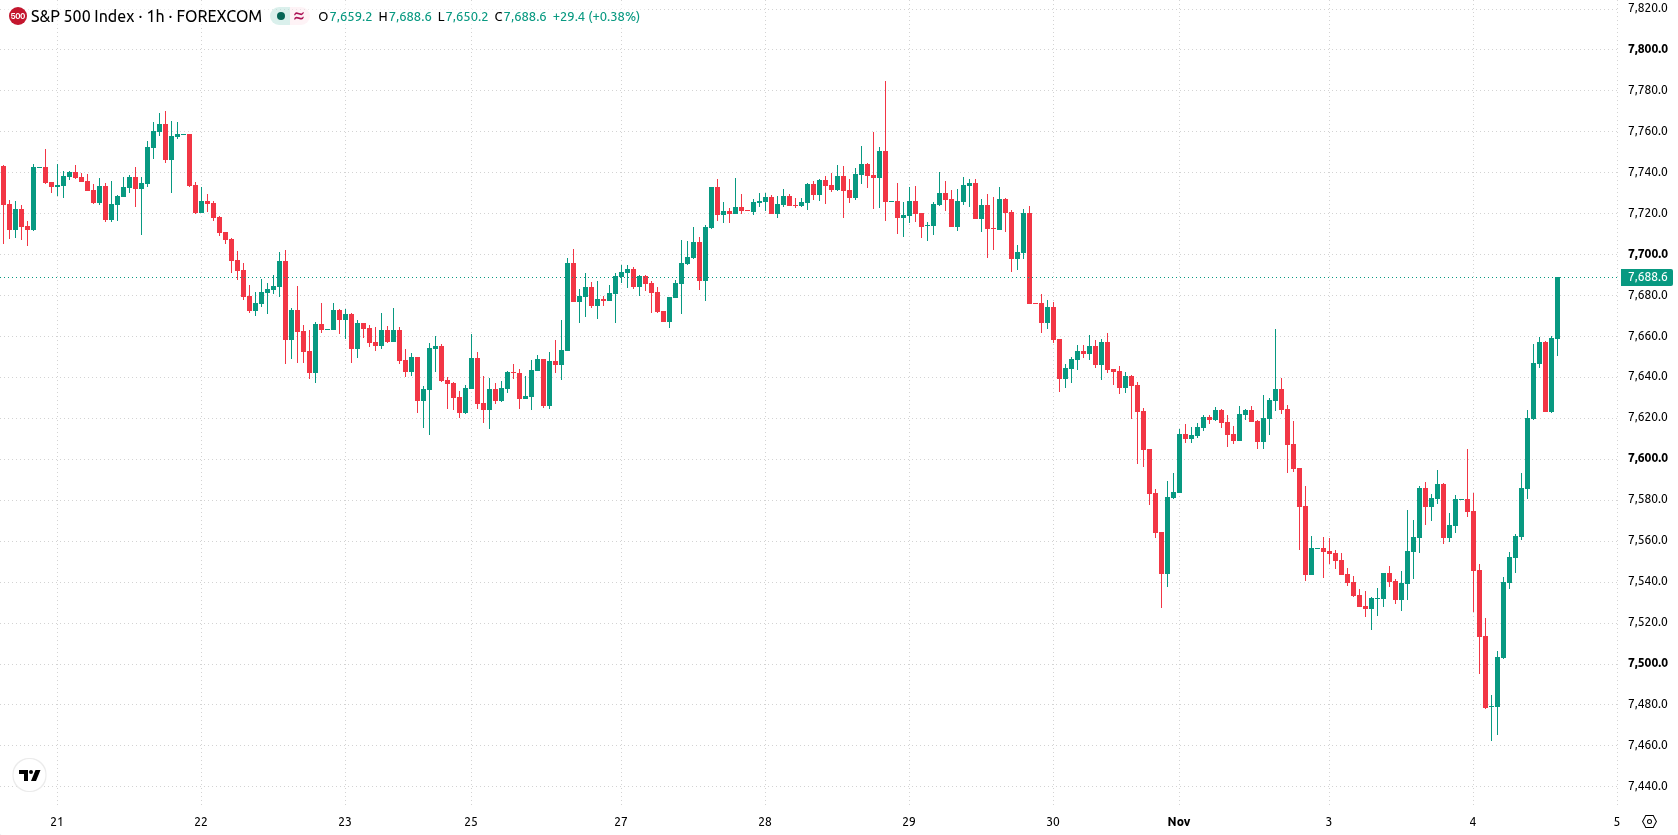
S&P 500 (SPX) is trading at 7,681, registering an increase of 1.49% for the day. The index is positioned above its key moving averages across both short- and longer-term timeframes, suggesting strong underlying momentum.
 7415.37
7649.65
Highlights
- Investors added 3.90 billion in gross purchases to SPY on November 2, providing immediate liquidity and supporting S&P 500 valuations.
- Restructurings at S&P 500 companies rose 20% year on year as firms advance artificial intelligence projects and enact cost controls.
- SPX/USD remains above key moving averages, but technical signals register weak momentum with a high likelihood of range-bound or downward movement between 7,563 and 7,727 over the next two days.
Liquidity surge and sector focus as investor demand climbs
Institutional and retail investors directed $3.90 billion in gross purchases into the SPDR S&P 500 ETF Trust (SPY) on November 2, signaling strong demand and supplying immediate liquidity to the index, according to Yahoo Finance. This influx of capital has contributed to increased support for S&P 500 valuations, particularly in leading technology and consumer sectors included in the ETF’s allocations. In parallel, the current earnings season has seen a roughly 20% year-on-year increase in S&P 500 company restructurings—largely driven by artificial intelligence initiatives and cost-cutting efforts, as reported by Newsbytesapp—which may further shape long-term fundamentals.
Conflicting momentum signals as SPX straddles key technical levels
SPX trades above its MA-20 and MA-50 on the hourly chart, with price also positioned above the MA-200 on the daily timeframe. The Ichimoku Kijun at 7,624 serves as immediate support. Momentum signals are mixed: MACD is on a strong sell signal and ADX remains in sell territory, while RSI, Stoch RSI, and CCI all show neutral readings, reflecting a market currently lacking clear overbought or oversold conditions. Bull/Bear Power remains negative, highlighting persistent seller influence during the session.
Range-bound outlook holds as volatility defines near-term action
In the short term, SPX is expected to oscillate between 7,563 and 7,727, with typical volatility contained within this band. The baseline scenario anticipates continued sideways movement. A decisive move above 7,727 would likely trigger fresh upside momentum, while a drop below 7,563 could expose the index to additional downside risk.
Previously it was reported that control of Congress shifting to the Democrats spurred a reversal in U.S. equity futures, highlighting the market’s sensitivity to political developments. The current technical setup and mixed momentum signals for the S&P 500 add a new layer to this view, suggesting that traders should closely monitor the 7,727 level for signs of a potential breakout amid prevailing sideways movement.






Latest S&P 500 News





-
 Afghanistan
-
 Albania
-
 Algeria
-
 Angola
-
 Argentina
-
 Armenia
-
 Australia
-
 Austria
-
 Azerbaijan
-
 Bahamas
-
 Bahrain
-
 Bangladesh
-
 Belarus
-
 Belgium
-
 Bolivia
-
 Botswana
-
 Brazil
-
 Brunei
-
 Bulgaria
-
 Cambodia
-
 Cameroon
-
 Canada
-
 Chile
-
 China
-
 Colombia
-
 Congo
-
 Costa Rica
-
 Cote d'Ivoire
-
 Croatia
-
 Cuba
-
 Cyprus
-
 Czechia
-
 DR Congo
-
 Denmark
-
 Dominican Republic
-
 Ecuador
-
 Egypt
-
 El Salvador
-
 Estonia
-
 Eswatini
-
 Ethiopia
-
 Finland
-
 France
-
 Georgia
-
 Germany
-
 Ghana
-
 Greece
-
 Haiti
-
 Hong Kong
-
 Hungary
-
 India
-
 Indonesia
-
 Iran, Islamic republic
-
 Iraq
-
 Ireland
-
 Israel
-
 Italy
-
 Jamaica
-
 Japan
-
 Jordan
-
 Kazakhstan
-
 Kenya
-
 Korea
-
 Kuwait
-
 Kyrgyzstan
-
 Laos
-
 Latvia
-
 Lebanon
-
 Lesotho
-
 Libya
-
 Lithuania
-
 Luxembourg
-
 Madagascar
-
 Malaysia
-
 Malta
-
 Mauritius
-
 Mexico
-
 Moldova
-
 Mongolia
-
 Montenegro
-
 Morocco
-
 Mozambique
-
 Myanmar
-
 Namibia
-
 Nepal
-
 Netherlands
-
 New Zealand
-
 Nigeria
-
 North Macedonia
-
 Norway
-
 Oman
-
 Pakistan
-
 Palestine
-
 Panama
-
 Papua New Guinea
-
 Paraguay
-
 Peru
-
 Philippines
-
 Poland
-
 Portugal
-
 Puerto Rico
-
 Qatar
-
 Reunion
-
 Romania
-
 Rwanda
-
 Saudi Arabia
-
 Serbia
-
 Singapore
-
 Slovakia
-
 Slovenia
-
 Somalia
-
 South Africa
-
 Spain
-
 Sri Lanka
-
 Sweden
-
 Switzerland
-
 Syria
-
 Taiwan
-
 Tajikistan
-
 Tanzania
-
 Thailand
-
 Trinidad and Tobago
-
 Tunisia
-
 Turkey
-
 UAE
-
 Uganda
-
 Ukraine
-
 United Kingdom
-
United States
-
 Uruguay
-
 Uzbekistan
-
 Venezuela
-
 Vietnam
-
 Yemen
-
 Zambia
-
 Zimbabwe
- Forex
- Crypto












