

Tesla shares technical analysis: Price weakens with bearish momentum in control

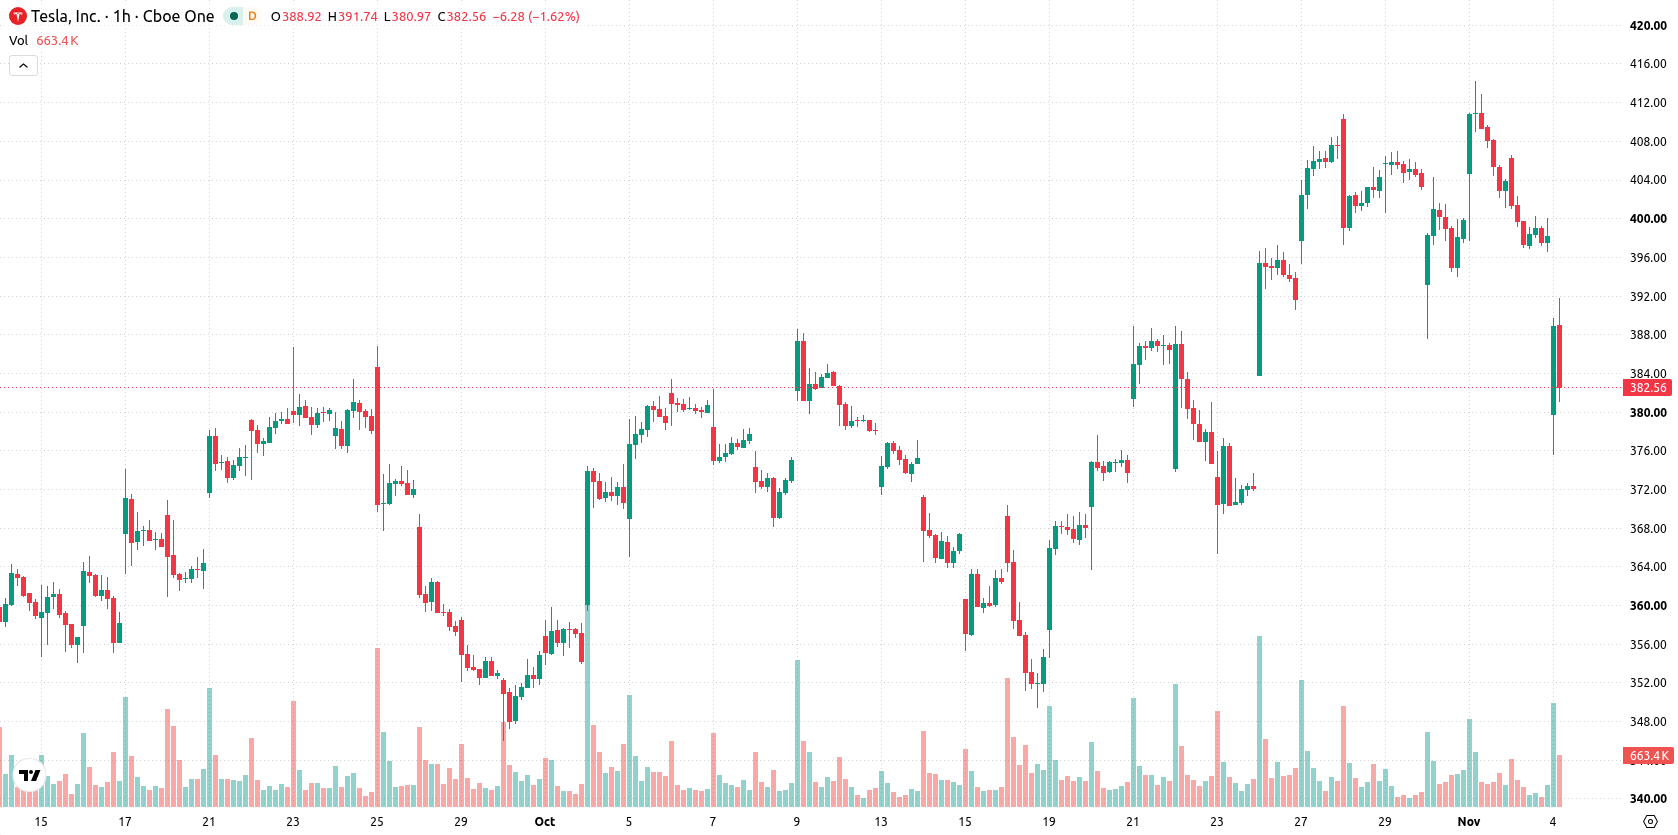
Tesla (TSLA) stock is trading at $381.7, down 4.22% on the day. The price is positioned below its key moving averages, reflecting intraday selling pressure.
 363.84
414.17
Highlights
- Tesla reported a 62% drop in free cash flow to $1.53 billion and raised capital expenditure guidance for 2026 to nearly $20 billion.
- R&D expenses increased to $2.76 billion as Tesla expanded software updates and promoted energy solutions in China.
- Shares of Tesla trade below key moving averages with bearish momentum, forecasting a range of $372.64 to $390.76 in the near term.
Investor confidence wanes as liquidity drops and costs rise
Tesla recorded a 62% decline in free cash flow to $1.53 billion as R&D expenses surged to $2.76 billion, and its capital expenditure guidance for 2026 is set near $20 billion, according to 247wallst. This significant drawdown in liquidity has raised concerns among investors about the company’s ability to sustain increasing business costs, which has contributed to negative sentiment around the stock. Tesla also launched the 2026.38.6 software update for non-FSD vehicles in North America and Europe and introduced Latvian language support, as reported by Teslaoracle. Additionally, the company is participating in the 9th China International Import Expo in Shanghai, promoting V4 Superchargers, Megapack, Powerwall, Solar solutions, and its energy infrastructure strategy for the Chinese market, according to Basenor.
Oversold momentum and bearish signals below critical resistance
On the hourly chart, TSLA is trading below the MA-20 at $400.93, the MA-50 at $401.52, and the MA-200 at $384.87. Immediate resistance is marked by the Ichimoku Kijun at $394.96. MACD signals a Sell, while ADX remains neutral. Momentum readings show RSI, Stoch RSI, and CCI all in oversold territory, suggesting conditions are stretched but not necessarily primed for reversal. Bull/Bear Power prints a negative value of -13.05, and the Awesome Oscillator confirms the bearish momentum.
Downside risk elevated with bearish momentum in current range
In the short term, TSLA is expected to trade within a range of $372.64 to $390.76. There is a 70% probability of the price moving lower versus a 30% chance of an upward move, as supported by current momentum and volatility. The base case is price action contained within this band. A break above resistance near $395 could spark a rebound, while a breakdown below $372.64 may accelerate further declines.
Earlier, analysts noted that Tesla’s outlook was clouded by regulatory uncertainty and the potential for a breakout from its previous consolidation. The current technical setup now signals downside risk, with a breakdown below $372.64 likely to accelerate additional weakness in the near term.











-
 Afghanistan
-
 Albania
-
 Algeria
-
 Angola
-
 Argentina
-
 Armenia
-
 Australia
-
 Austria
-
 Azerbaijan
-
 Bahamas
-
 Bahrain
-
 Bangladesh
-
 Belarus
-
 Belgium
-
 Bolivia
-
 Botswana
-
 Brazil
-
 Brunei
-
 Bulgaria
-
 Cambodia
-
 Cameroon
-
 Canada
-
 Chile
-
 China
-
 Colombia
-
 Congo
-
 Costa Rica
-
 Cote d'Ivoire
-
 Croatia
-
 Cuba
-
 Cyprus
-
 Czechia
-
 DR Congo
-
 Denmark
-
 Dominican Republic
-
 Ecuador
-
 Egypt
-
 El Salvador
-
 Estonia
-
 Eswatini
-
 Ethiopia
-
 Finland
-
 France
-
 Georgia
-
 Germany
-
 Ghana
-
 Greece
-
 Haiti
-
 Hong Kong
-
 Hungary
-
 India
-
 Indonesia
-
 Iran, Islamic republic
-
 Iraq
-
 Ireland
-
 Israel
-
 Italy
-
 Jamaica
-
 Japan
-
 Jordan
-
 Kazakhstan
-
 Kenya
-
 Korea
-
 Kuwait
-
 Kyrgyzstan
-
 Laos
-
 Latvia
-
 Lebanon
-
 Lesotho
-
 Libya
-
 Lithuania
-
 Luxembourg
-
 Madagascar
-
 Malaysia
-
 Malta
-
 Mauritius
-
 Mexico
-
 Moldova
-
 Mongolia
-
 Montenegro
-
 Morocco
-
 Mozambique
-
 Myanmar
-
 Namibia
-
 Nepal
-
 Netherlands
-
 New Zealand
-
 Nigeria
-
 North Macedonia
-
 Norway
-
 Oman
-
 Pakistan
-
 Palestine
-
 Panama
-
 Papua New Guinea
-
 Paraguay
-
 Peru
-
 Philippines
-
 Poland
-
 Portugal
-
 Puerto Rico
-
 Qatar
-
 Reunion
-
 Romania
-
 Rwanda
-
 Saudi Arabia
-
 Serbia
-
 Singapore
-
 Slovakia
-
 Slovenia
-
 Somalia
-
 South Africa
-
 Spain
-
 Sri Lanka
-
 Sweden
-
 Switzerland
-
 Syria
-
 Taiwan
-
 Tajikistan
-
 Tanzania
-
 Thailand
-
 Trinidad and Tobago
-
 Tunisia
-
 Turkey
-
 UAE
-
 Uganda
-
 Ukraine
-
 United Kingdom
-
United States
-
 Uruguay
-
 Uzbekistan
-
 Venezuela
-
 Vietnam
-
 Yemen
-
 Zambia
-
 Zimbabwe
- Forex
- Crypto












