

Will MARA hold above $6.79 support amid mixed trading signals and earnings uncertainty?

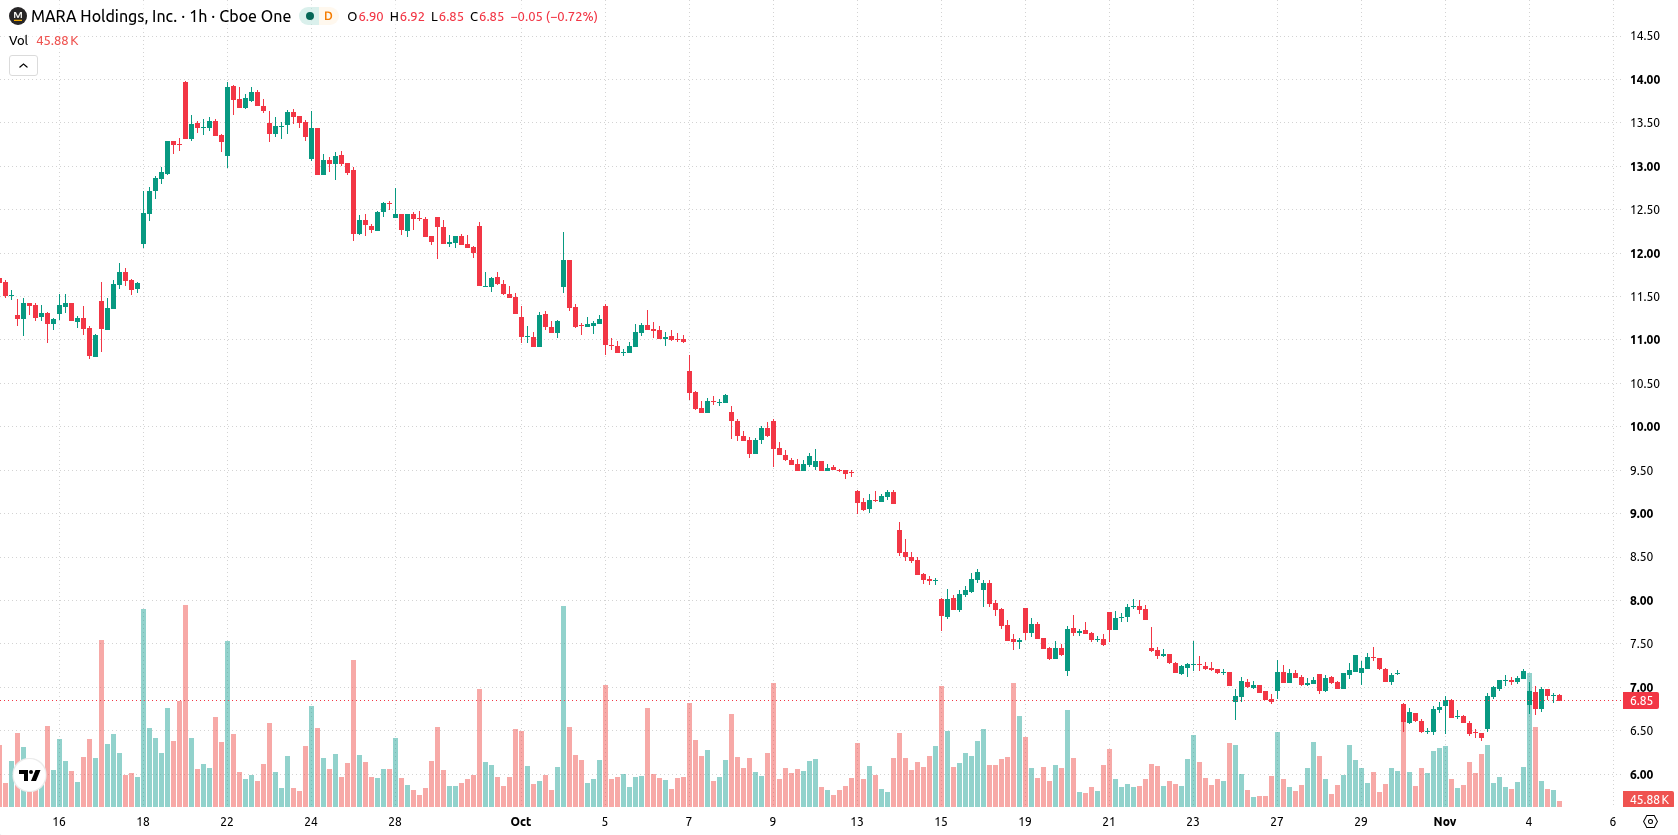
Marathon Digital Holdings (MARA, formerly Marathon Patent Group) stock is trading at $6.89, down 3.84% on the day. The price sits above its short-term moving average but remains below its medium- and long-term trend indicators.
 6.41
7.19
Highlights
- Marathon Digital Holdings will release its third quarter 2026 results on November 9, 2026, with investor focus on new disclosures.
- The company held 35,577 Bitcoin as of November 4, 2026, concentrating equity risk on Bitcoin price volatility.
- Shares of Marathon Digital face high downside probability with a forecasted range of $6.36 to $7.37 and sustained selling pressure indicated by technicals.
Earnings anticipation heightens risk amid Bitcoin-linked volatility
Marathon Digital Holdings is slated to announce its third quarter 2026 results after the close on November 9, 2026, an upcoming event that often prompts investor caution as markets assess the potential for new financial disclosures. The company’s sizable holding of 35,577 Bitcoin as of November 4, 2026, materially links its equity risk to cryptocurrency price fluctuations, amplifying sensitivity to broader Bitcoin market conditions. Last week’s positive movement, when shares responded to a sector rebound in Bitcoin mining and AI infrastructure, has since faded as investors focus on the pending earnings report, though price action has remained under broader selling pressure.
Mixed technical momentum as moving averages cap upside
The $6.79 moving average (MA-20) on the hourly chart is currently acting as an initial support point, while the MA-50 sits overhead at $6.95 and limits further upside attempts in the session. The daily MA-200 at $10.75 remains a higher resistance level, underscoring a longer-term cap on recovery efforts. The Ichimoku Kijun at $6.8 marks immediate support. Among key indicators, MACD presently signals a Buy, but ADX reflects prevailing bearish conditions. The RSI and Stoch RSI, supported by a neutral CCI, do not indicate excess momentum in either direction. Bull/Bear Power shows a mild positive intraday bias at 0.09, and the Awesome Oscillator remains neutral, reaffirming the mixed signal landscape.
Sideways movement seen as volatility persists near key levels
Looking ahead, price is anticipated to remain volatile within a forecast range of $6.36 to $7.37 over the next several sessions, consistent with recent trading swings. The baseline scenario is for MARA to oscillate sideways between these support and resistance benchmarks. A bullish scenario would require a sustained breakout above $7.37, potentially drawing renewed buyer interest, while a break below $6.36 could prompt accelerated selling and test the lower end of the current volatility band.
Earlier, analysts noted that Marathon Digital's technical outlook was defined by prevailing downside risk, with sellers expected to maintain pressure ahead of its upcoming earnings release. The current analysis adds that amid mixed indicator signals and heightened sensitivity to broader Bitcoin price movements, the $6.36 support level is crucial to monitor for signs of a possible breakdown or stabilization in the near term.









-
 Afghanistan
-
 Albania
-
 Algeria
-
 Angola
-
 Argentina
-
 Armenia
-
 Australia
-
 Austria
-
 Azerbaijan
-
 Bahamas
-
 Bahrain
-
 Bangladesh
-
 Belarus
-
 Belgium
-
 Bolivia
-
 Botswana
-
 Brazil
-
 Brunei
-
 Bulgaria
-
 Cambodia
-
 Cameroon
-
 Canada
-
 Chile
-
 China
-
 Colombia
-
 Congo
-
 Costa Rica
-
 Cote d'Ivoire
-
 Croatia
-
 Cuba
-
 Cyprus
-
 Czechia
-
 DR Congo
-
 Denmark
-
 Dominican Republic
-
 Ecuador
-
 Egypt
-
 El Salvador
-
 Estonia
-
 Eswatini
-
 Ethiopia
-
 Finland
-
 France
-
 Georgia
-
 Germany
-
 Ghana
-
 Greece
-
 Haiti
-
 Hong Kong
-
 Hungary
-
 India
-
 Indonesia
-
 Iran, Islamic republic
-
 Iraq
-
 Ireland
-
 Israel
-
 Italy
-
 Jamaica
-
 Japan
-
 Jordan
-
 Kazakhstan
-
 Kenya
-
 Korea
-
 Kuwait
-
 Kyrgyzstan
-
 Laos
-
 Latvia
-
 Lebanon
-
 Lesotho
-
 Libya
-
 Lithuania
-
 Luxembourg
-
 Madagascar
-
 Malaysia
-
 Malta
-
 Mauritius
-
 Mexico
-
 Moldova
-
 Mongolia
-
 Montenegro
-
 Morocco
-
 Mozambique
-
 Myanmar
-
 Namibia
-
 Nepal
-
 Netherlands
-
 New Zealand
-
 Nigeria
-
 North Macedonia
-
 Norway
-
 Oman
-
 Pakistan
-
 Palestine
-
 Panama
-
 Papua New Guinea
-
 Paraguay
-
 Peru
-
 Philippines
-
 Poland
-
 Portugal
-
 Puerto Rico
-
 Qatar
-
 Reunion
-
 Romania
-
 Rwanda
-
 Saudi Arabia
-
 Serbia
-
 Singapore
-
 Slovakia
-
 Slovenia
-
 Somalia
-
 South Africa
-
 Spain
-
 Sri Lanka
-
 Sweden
-
 Switzerland
-
 Syria
-
 Taiwan
-
 Tajikistan
-
 Tanzania
-
 Thailand
-
 Trinidad and Tobago
-
 Tunisia
-
 Turkey
-
 UAE
-
 Uganda
-
 Ukraine
-
 United Kingdom
-
United States
-
 Uruguay
-
 Uzbekistan
-
 Venezuela
-
 Vietnam
-
 Yemen
-
 Zambia
-
 Zimbabwe
- Forex
- Crypto












