

MSFT falls as downward price move dominates after volatile session

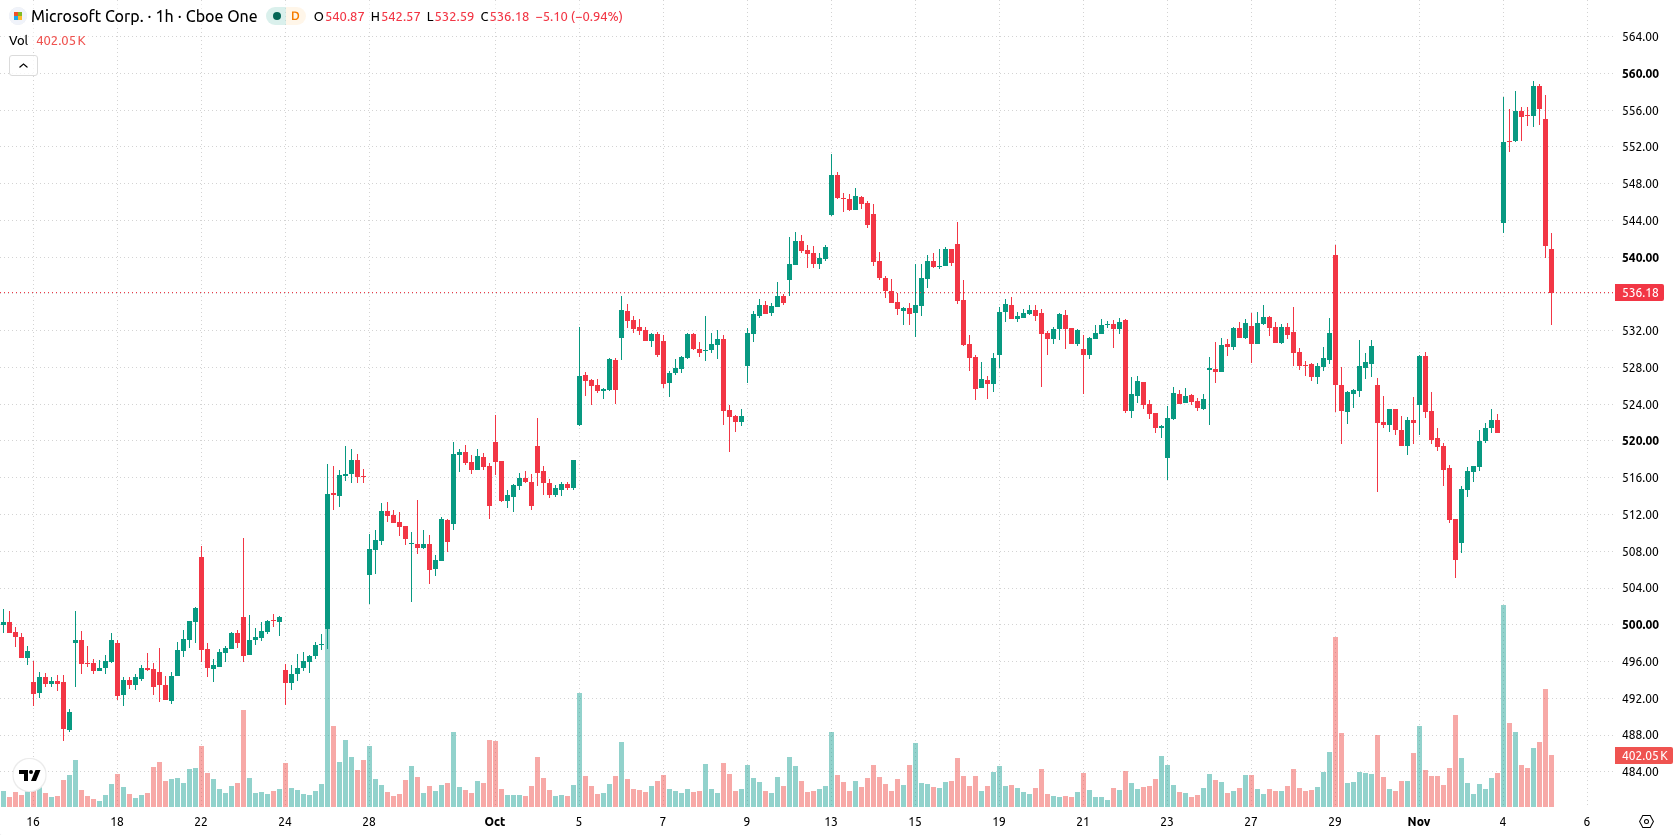
Microsoft (MSFT) stock is trading at $537.27, closing the session down 3.33% after opening with a sharp gap lower. The stock currently sits above its key moving averages, indicating robust performance across timeframes despite today’s volatility.
 538.19
559.07
Highlights
- Microsoft stock gained from a 43% year-over-year surge in Azure revenue and ongoing Copilot expansion in fiscal Q1 2027.
- Enterprise AI demand lifted earnings, with capital expenditures reaching $45.2 billion and exchange-traded funds acquiring $561.6 million in shares.
- Technical signals indicate bullish structure across timeframes, with price expected to trade between $513.18 and $561.36 in coming sessions.
Institutional inflows rise as AI growth drives earnings beat
Microsoft reported fiscal first-quarter 2027 results that beat Wall Street forecasts, as documented by Themarketsdaily, underscoring robust performance driven by a 43% year-over-year increase in Azure revenue and the continued rollout of Copilot. Yahoo Finance further noted that earnings benefited from strong demand across enterprise AI services, while capital expenditures for the quarter totaled $45.2 billion, demonstrating ongoing investment in cloud and AI infrastructure. Additionally, Gurufocus reported that exchange-traded funds acquired $561.6 million in Microsoft stock during the latest session, reflecting increased allocation from institutional investors, though price action has remained under broader selling pressure.
Bullish bias shown by MA alignment and strong momentum signals
Technical analysis shows that MSFT is above the MA-20 ($532.11) and MA-50 ($529.19) on the H1 timeframe, and remains well above the long-term MA-200 ($438.97). Immediate support is defined by the Ichimoku Kijun at $532.05. Momentum indicators reveal that MACD has generated a Buy signal and ADX points to bullish strength, while RSI, Stochastic RSI, and CCI all remain in neutral territory. Bull/Bear Power is positive at 13.7, denoting active intraday buyer presence, and the Awesome Oscillator displays a neutral stance. Price activity closed near session lows in a period of elevated volatility.
Mild upside odds as volatility defines trading range
In the short term, the anticipated trading range for MSFT spans $513.18 to $561.36, reflecting a typical volatility band relative to current levels. Model probabilities suggest a 68% chance of upward movement against a 32% risk of decline, favoring scenarios that keep price action within this corridor. A bullish breakout could see MSFT extend gains above resistance, whereas renewed downward momentum may result in a breach of support and further declines toward the lower bound.
Previously it was reported that Microsoft declined to expand a major AI computing agreement in Texas, maintaining its current commitments but opting against additional infrastructure investment with Nscale. In light of the company's strong quarterly results and continuous capital allocation to AI and cloud capabilities, traders should monitor whether Microsoft's ongoing expenditure strategy continues to support price action within the $513.18 to $561.36 trading range.






Latest Microsoft News




-
 Afghanistan
-
 Albania
-
 Algeria
-
 Angola
-
 Argentina
-
 Armenia
-
 Australia
-
 Austria
-
 Azerbaijan
-
 Bahamas
-
 Bahrain
-
 Bangladesh
-
 Belarus
-
 Belgium
-
 Bolivia
-
 Botswana
-
 Brazil
-
 Brunei
-
 Bulgaria
-
 Cambodia
-
 Cameroon
-
 Canada
-
 Chile
-
 China
-
 Colombia
-
 Congo
-
 Costa Rica
-
 Cote d'Ivoire
-
 Croatia
-
 Cuba
-
 Cyprus
-
 Czechia
-
 DR Congo
-
 Denmark
-
 Dominican Republic
-
 Ecuador
-
 Egypt
-
 El Salvador
-
 Estonia
-
 Eswatini
-
 Ethiopia
-
 Finland
-
 France
-
 Georgia
-
 Germany
-
 Ghana
-
 Greece
-
 Haiti
-
 Hong Kong
-
 Hungary
-
 India
-
 Indonesia
-
 Iran, Islamic republic
-
 Iraq
-
 Ireland
-
 Israel
-
 Italy
-
 Jamaica
-
 Japan
-
 Jordan
-
 Kazakhstan
-
 Kenya
-
 Korea
-
 Kuwait
-
 Kyrgyzstan
-
 Laos
-
 Latvia
-
 Lebanon
-
 Lesotho
-
 Libya
-
 Lithuania
-
 Luxembourg
-
 Madagascar
-
 Malaysia
-
 Malta
-
 Mauritius
-
 Mexico
-
 Moldova
-
 Mongolia
-
 Montenegro
-
 Morocco
-
 Mozambique
-
 Myanmar
-
 Namibia
-
 Nepal
-
 Netherlands
-
 New Zealand
-
 Nigeria
-
 North Macedonia
-
 Norway
-
 Oman
-
 Pakistan
-
 Palestine
-
 Panama
-
 Papua New Guinea
-
 Paraguay
-
 Peru
-
 Philippines
-
 Poland
-
 Portugal
-
 Puerto Rico
-
 Qatar
-
 Reunion
-
 Romania
-
 Rwanda
-
 Saudi Arabia
-
 Serbia
-
 Singapore
-
 Slovakia
-
 Slovenia
-
 Somalia
-
 South Africa
-
 Spain
-
 Sri Lanka
-
 Sweden
-
 Switzerland
-
 Syria
-
 Taiwan
-
 Tajikistan
-
 Tanzania
-
 Thailand
-
 Trinidad and Tobago
-
 Tunisia
-
 Turkey
-
 UAE
-
 Uganda
-
 Ukraine
-
 United Kingdom
-
United States
-
 Uruguay
-
 Uzbekistan
-
 Venezuela
-
 Vietnam
-
 Yemen
-
 Zambia
-
 Zimbabwe
- Forex
- Crypto












