

Bakkt stock falls nearly 14% as bearish momentum and selling pressure persist

Bakkt Holdings (BKKT) fell sharply by 13.63% as persistent bearish technical signals and strong intraday selling weighed on sentiment. The move is reinforced by the stock remaining below all key moving averages, with sellers dominating the current action.
 3.14
4.35
Highlights
- Bakkt stock is trading below key medium and long-term moving averages, signaling persistent bearish pressure.
- Shares fell sharply by 13.63% to $4.12, remaining close to the low of the day with 18.61% intraday volatility.
- Technical indicators suggest sellers dominate, with an expected five-day price range of $3.82 to $4.42 and a high probability of further declines.
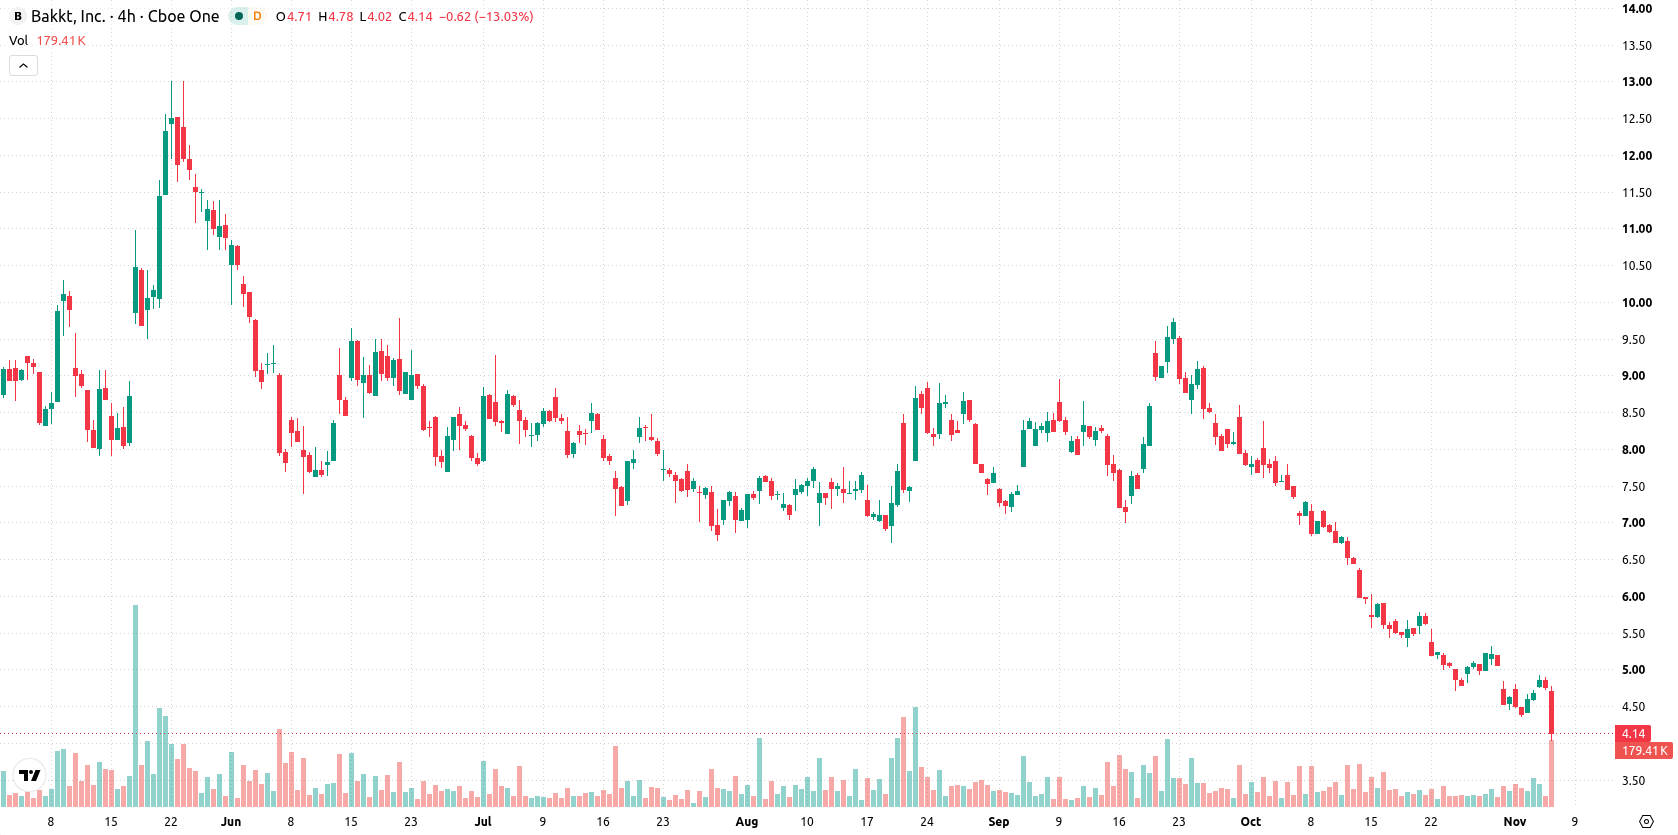
Bearish momentum confirmed as price breaches key averages and support
Bakkt is trading below its 20-day, 50-day, and 200-day moving averages ($5.51, $7.04, and $8.64, respectively), confirming a bearish alignment for both the medium and long term. The near-term ceiling stands at $4.34, while immediate support is identified at $4.03. Momentum indicators continue to tilt negative, with a bearish signal from both the MACD and ADX. The RSI and CCI readings remain neutral, and the Stochastic RSI is in the overbought zone, suggesting risk of a short-term downside correction. BBP underlines ongoing seller dominance in intraday trading. Volatility is elevated at 18.61%, and daily momentum confirms continued negative sentiment.
Earlier, analysts noted that Bakkt's technical outlook remained weak, with sellers maintaining an advantage as downside pressure persisted. The latest data reinforces this bearish stance, with traders advised to monitor $4.03 as a key support level that could signal further downside risk if breached.









-
 Afghanistan
-
 Albania
-
 Algeria
-
 Angola
-
 Argentina
-
 Armenia
-
 Australia
-
 Austria
-
 Azerbaijan
-
 Bahamas
-
 Bahrain
-
 Bangladesh
-
 Belarus
-
 Belgium
-
 Bolivia
-
 Botswana
-
 Brazil
-
 Brunei
-
 Bulgaria
-
 Cambodia
-
 Cameroon
-
 Canada
-
 Chile
-
 China
-
 Colombia
-
 Congo
-
 Costa Rica
-
 Cote d'Ivoire
-
 Croatia
-
 Cuba
-
 Cyprus
-
 Czechia
-
 DR Congo
-
 Denmark
-
 Dominican Republic
-
 Ecuador
-
 Egypt
-
 El Salvador
-
 Estonia
-
 Eswatini
-
 Ethiopia
-
 Finland
-
 France
-
 Georgia
-
 Germany
-
 Ghana
-
 Greece
-
 Haiti
-
 Hong Kong
-
 Hungary
-
 India
-
 Indonesia
-
 Iran, Islamic republic
-
 Iraq
-
 Ireland
-
 Israel
-
 Italy
-
 Jamaica
-
 Japan
-
 Jordan
-
 Kazakhstan
-
 Kenya
-
 Korea
-
 Kuwait
-
 Kyrgyzstan
-
 Laos
-
 Latvia
-
 Lebanon
-
 Lesotho
-
 Libya
-
 Lithuania
-
 Luxembourg
-
 Madagascar
-
 Malaysia
-
 Malta
-
 Mauritius
-
 Mexico
-
 Moldova
-
 Mongolia
-
 Montenegro
-
 Morocco
-
 Mozambique
-
 Myanmar
-
 Namibia
-
 Nepal
-
 Netherlands
-
 New Zealand
-
 Nigeria
-
 North Macedonia
-
 Norway
-
 Oman
-
 Pakistan
-
 Palestine
-
 Panama
-
 Papua New Guinea
-
 Paraguay
-
 Peru
-
 Philippines
-
 Poland
-
 Portugal
-
 Puerto Rico
-
 Qatar
-
 Reunion
-
 Romania
-
 Rwanda
-
 Saudi Arabia
-
 Serbia
-
 Singapore
-
 Slovakia
-
 Slovenia
-
 Somalia
-
 South Africa
-
 Spain
-
 Sri Lanka
-
 Sweden
-
 Switzerland
-
 Syria
-
 Taiwan
-
 Tajikistan
-
 Tanzania
-
 Thailand
-
 Trinidad and Tobago
-
 Tunisia
-
 Turkey
-
 UAE
-
 Uganda
-
 Ukraine
-
 United Kingdom
-
United States
-
 Uruguay
-
 Uzbekistan
-
 Venezuela
-
 Vietnam
-
 Yemen
-
 Zambia
-
 Zimbabwe
- Forex
- Crypto












