


Persistent selling pressure drove LKQ Corporation (LKQ) down 3.39% today, with intraday losses reflecting sustained downside momentum and negative technical signals. The severity of the drop is supported by the stock’s position below all key moving averages, signaling a bearish trend backdrop that continues to weigh on any potential recovery.
 19.37
20.25
Highlights
- Shares of LKQ are trading below key moving averages with a bearish medium and long-term trend setup.
- Momentum is negative with a strong MACD sell signal, but oscillators remain mixed and overall bias is pressured.
- Expected trading range for the next 5 days is $18.7 to $21.82, with immediate resistance at $20.35 and support at $20.18.
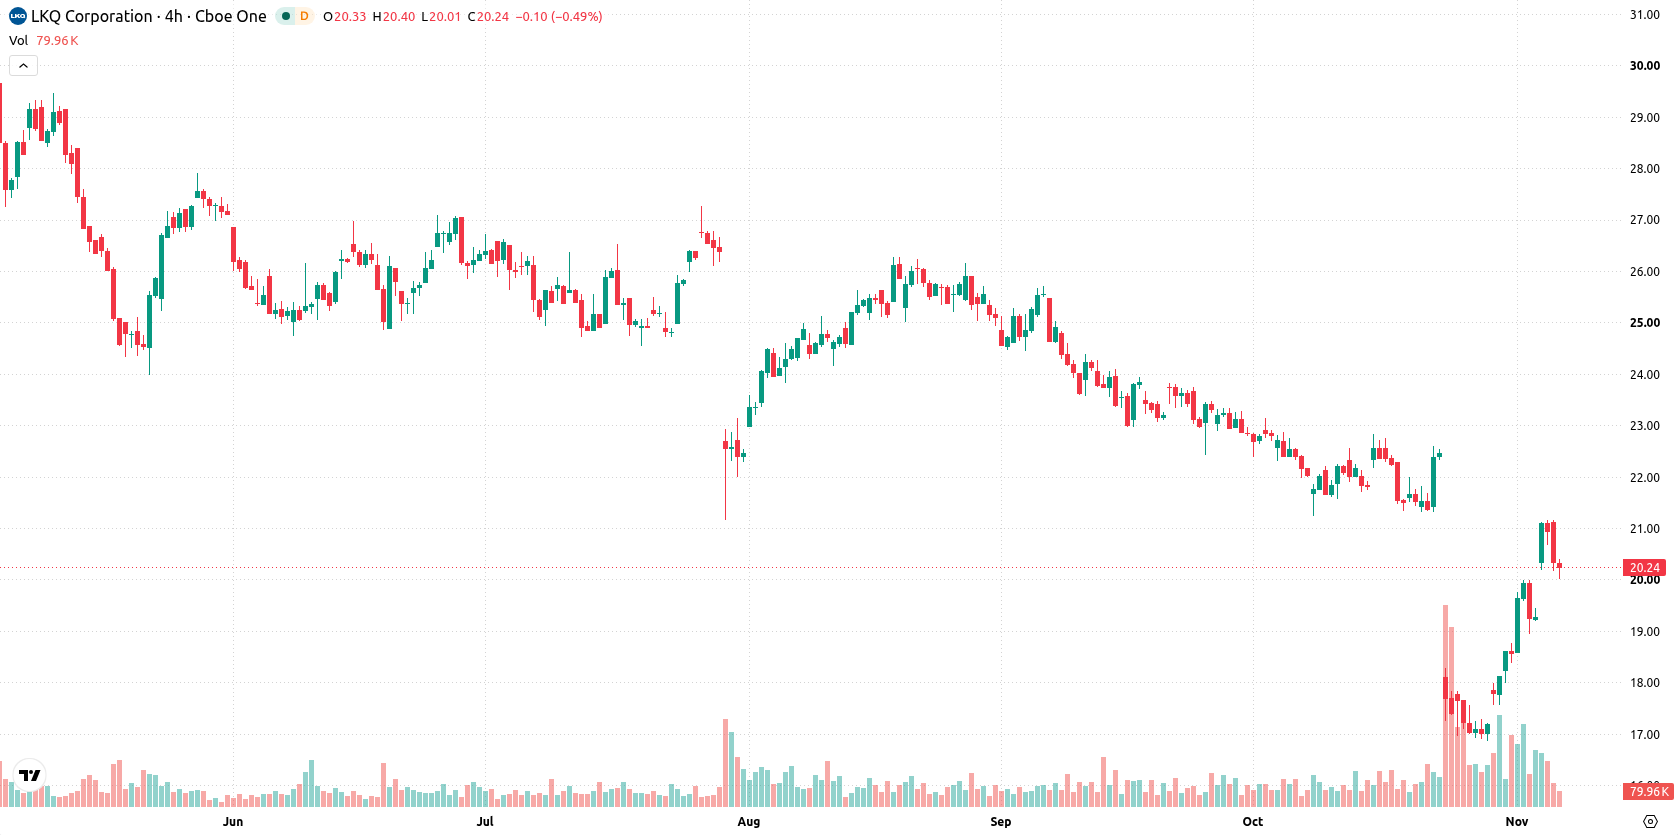
Bearish structure confirmed as technical signals diverge
LKQ is trading below its 20-day, 50-day, and 200-day moving averages, with the current price of $20.26 under the $20.35 (MA-20), $22.42 (MA-50), and $26.96 (MA-200) levels. This alignment points to persistent pressure from sellers across short-, medium-, and long-term trends, with a bearish medium/long-term structure confirmed by the MA-50 versus MA-200 alignment. Immediate resistance is set at $20.35 and support at $20.18. Looking at momentum indicators, the MACD gives a strong sell signal, indicating negative momentum, while the Average Directional Index (ADX) signals a buy, denoting a strengthening trend backdrop. The Relative Strength Index (RSI) and Commodity Channel Index (CCI) are both neutral, showing no current overbought or oversold conditions. The Stochastic RSI is in the overbought zone, indicating a potential downside correction risk. Bull/Bear Power (BBP) is positive at 1.47, suggesting buyers still maintain some intraday activity. The overall technical tone remains pressured with mixed signals from momentum indicators and oscillators.
Earlier, analysts noted that LKQ's persistent downside momentum was reinforced by both bearish technical indicators and fundamental challenges. The current technical setup adds nuance by revealing mixed momentum signals and a neutral oscillator backdrop, making $20.35 resistance and $20.18 support critical levels to monitor for directional confirmation in the near term.






Latest LKQ Corporation News




-
 Afghanistan
-
 Albania
-
 Algeria
-
 Angola
-
 Argentina
-
 Armenia
-
 Australia
-
 Austria
-
 Azerbaijan
-
 Bahamas
-
 Bahrain
-
 Bangladesh
-
 Belarus
-
 Belgium
-
 Bolivia
-
 Botswana
-
 Brazil
-
 Brunei
-
 Bulgaria
-
 Cambodia
-
 Cameroon
-
 Canada
-
 Chile
-
 China
-
 Colombia
-
 Congo
-
 Costa Rica
-
 Cote d'Ivoire
-
 Croatia
-
 Cuba
-
 Cyprus
-
 Czechia
-
 DR Congo
-
 Denmark
-
 Dominican Republic
-
 Ecuador
-
 Egypt
-
 El Salvador
-
 Estonia
-
 Eswatini
-
 Ethiopia
-
 Finland
-
 France
-
 Georgia
-
 Germany
-
 Ghana
-
 Greece
-
 Haiti
-
 Hong Kong
-
 Hungary
-
 India
-
 Indonesia
-
 Iran, Islamic republic
-
 Iraq
-
 Ireland
-
 Israel
-
 Italy
-
 Jamaica
-
 Japan
-
 Jordan
-
 Kazakhstan
-
 Kenya
-
 Korea
-
 Kuwait
-
 Kyrgyzstan
-
 Laos
-
 Latvia
-
 Lebanon
-
 Lesotho
-
 Libya
-
 Lithuania
-
 Luxembourg
-
 Madagascar
-
 Malaysia
-
 Malta
-
 Mauritius
-
 Mexico
-
 Moldova
-
 Mongolia
-
 Montenegro
-
 Morocco
-
 Mozambique
-
 Myanmar
-
 Namibia
-
 Nepal
-
 Netherlands
-
 New Zealand
-
 Nigeria
-
 North Macedonia
-
 Norway
-
 Oman
-
 Pakistan
-
 Palestine
-
 Panama
-
 Papua New Guinea
-
 Paraguay
-
 Peru
-
 Philippines
-
 Poland
-
 Portugal
-
 Puerto Rico
-
 Qatar
-
 Reunion
-
 Romania
-
 Rwanda
-
 Saudi Arabia
-
 Serbia
-
 Singapore
-
 Slovakia
-
 Slovenia
-
 Somalia
-
 South Africa
-
 Spain
-
 Sri Lanka
-
 Sweden
-
 Switzerland
-
 Syria
-
 Taiwan
-
 Tajikistan
-
 Tanzania
-
 Thailand
-
 Trinidad and Tobago
-
 Tunisia
-
 Turkey
-
 UAE
-
 Uganda
-
 Ukraine
-
 United Kingdom
-
United States
-
 Uruguay
-
 Uzbekistan
-
 Venezuela
-
 Vietnam
-
 Yemen
-
 Zambia
-
 Zimbabwe
- Forex
- Crypto












