

Denison Mines stock slides as downward price move follows earnings disappointment and volatile trading

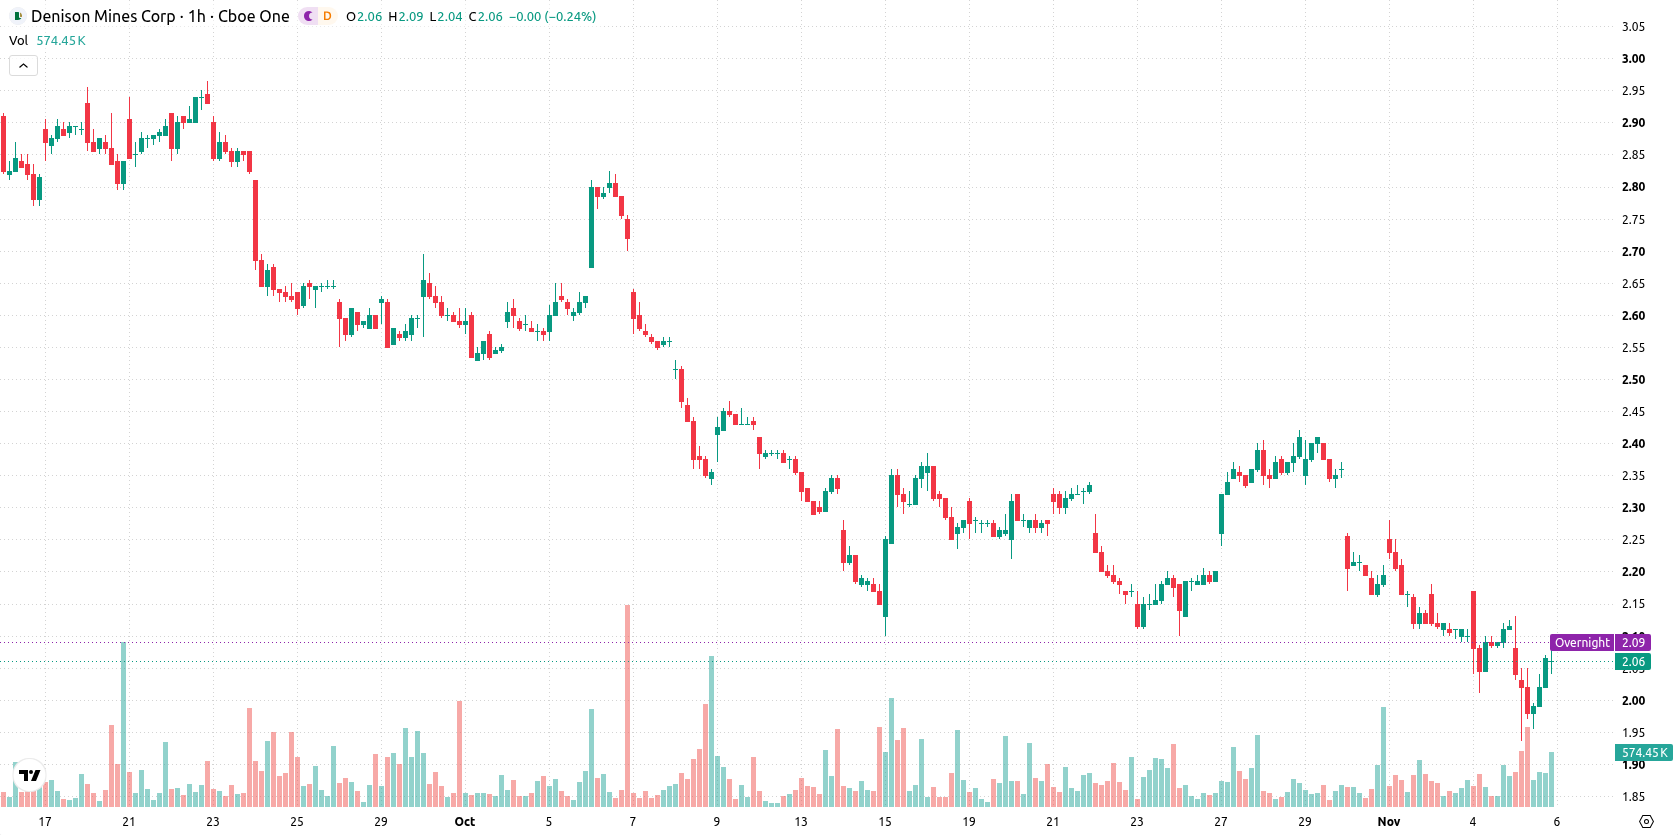
Denison Mines (DNN) stock is trading at $2.06 after a 2.6% decline for the session. The stock currently sits below its key moving averages and is experiencing heightened volatility near today's intraday highs.
 2.22
2.28
Highlights
- Denison Mines reported a non-GAAP loss per share of -C$0.03 for Q3 2026, missing consensus estimates by C$0.01.
- The Phoenix uranium project faced a C$20 million rise in construction costs linked to regional flooding, with project completion at 24% as of September 30.
- Shares of Denison Mines closed at $2.06 with persistent bearish technical signals, and are expected to trade between $1.91 and $2.21 over the next several sessions.
Earnings miss and project cost surge dampen investor sentiment
Denison Mines announced a non-GAAP loss per share of -C$0.03 for the third quarter of 2026, falling short of consensus estimates by C$0.01 and driving an earnings disappointment. The company reported a net income of CAD 81.77 million, a reversal from a loss a year before, but this was offset by higher construction costs on its Phoenix uranium project after regional flooding added $20 million to anticipated expenditures. The transition of the Phoenix project to capital expenditure accounting, with 24% completion as of September 30 and ongoing sales negotiations for uranium, highlights both progress and near-term margin pressure. Despite maintaining CAD 363 million in liquidity and securing long-term supply contracts, results have been overshadowed by the earnings miss and temporary rise in costs, dampening sentiment.
Mixed momentum and resistance near $2.08 constrain upside attempts
On the technical front, DNN/USD is trading below the MA-20 and MA-50 on the hourly chart, and remains well below the MA-200 on the daily timeframe. The Ichimoku Kijun at $2.08 serves as immediate resistance for short-term upward moves, while nearby support is located near $1.91. Momentum indicators are mixed: MACD is signaling Strong Sell, ADX also reflects continued selling, while RSI and CCI are neutral. Stochastic RSI stands in explicitly overbought territory, suggesting potential for an intraday pullback, and Bull/Bear Power sits just above zero, pointing to limited but present buyer activity.
Downside bias persists as breakout levels define next move
Over the next several sessions, DNN/USD is projected to consolidate between $1.91 and $2.21, reflecting typical volatility for current conditions. The probability model suggests a 74% chance of further downside versus 26% for a rebound. A move above $2.08 would be required to trigger a bullish scenario, while a break below $1.91 would confirm renewed selling pressure.
Previously it was reported that Denison Mines remained under persistent bearish pressure following a disappointing earnings release and weak technical signals. The current article strengthens this view by highlighting continued downside risk and elevated volatility, with $1.91 serving as a pivotal level that may determine the near-term trading direction.






Latest Denison Mines News




-
 Afghanistan
-
 Albania
-
 Algeria
-
 Angola
-
 Argentina
-
 Armenia
-
 Australia
-
 Austria
-
 Azerbaijan
-
 Bahamas
-
 Bahrain
-
 Bangladesh
-
 Belarus
-
 Belgium
-
 Bolivia
-
 Botswana
-
 Brazil
-
 Brunei
-
 Bulgaria
-
 Cambodia
-
 Cameroon
-
 Canada
-
 Chile
-
 China
-
 Colombia
-
 Congo
-
 Costa Rica
-
 Cote d'Ivoire
-
 Croatia
-
 Cuba
-
 Cyprus
-
 Czechia
-
 DR Congo
-
 Denmark
-
 Dominican Republic
-
 Ecuador
-
 Egypt
-
 El Salvador
-
 Estonia
-
 Eswatini
-
 Ethiopia
-
 Finland
-
 France
-
 Georgia
-
 Germany
-
 Ghana
-
 Greece
-
 Haiti
-
 Hong Kong
-
 Hungary
-
 India
-
 Indonesia
-
 Iran, Islamic republic
-
 Iraq
-
 Ireland
-
 Israel
-
 Italy
-
 Jamaica
-
 Japan
-
 Jordan
-
 Kazakhstan
-
 Kenya
-
 Korea
-
 Kuwait
-
 Kyrgyzstan
-
 Laos
-
 Latvia
-
 Lebanon
-
 Lesotho
-
 Libya
-
 Lithuania
-
 Luxembourg
-
 Madagascar
-
 Malaysia
-
 Malta
-
 Mauritius
-
 Mexico
-
 Moldova
-
 Mongolia
-
 Montenegro
-
 Morocco
-
 Mozambique
-
 Myanmar
-
 Namibia
-
 Nepal
-
 Netherlands
-
 New Zealand
-
 Nigeria
-
 North Macedonia
-
 Norway
-
 Oman
-
 Pakistan
-
 Palestine
-
 Panama
-
 Papua New Guinea
-
 Paraguay
-
 Peru
-
 Philippines
-
 Poland
-
 Portugal
-
 Puerto Rico
-
 Qatar
-
 Reunion
-
 Romania
-
 Rwanda
-
 Saudi Arabia
-
 Serbia
-
 Singapore
-
 Slovakia
-
 Slovenia
-
 Somalia
-
 South Africa
-
 Spain
-
 Sri Lanka
-
 Sweden
-
 Switzerland
-
 Syria
-
 Taiwan
-
 Tajikistan
-
 Tanzania
-
 Thailand
-
 Trinidad and Tobago
-
 Tunisia
-
 Turkey
-
 UAE
-
 Uganda
-
 Ukraine
-
 United Kingdom
-
United States
-
 Uruguay
-
 Uzbekistan
-
 Venezuela
-
 Vietnam
-
 Yemen
-
 Zambia
-
 Zimbabwe
- Forex
- Crypto












