

Royal Bank of Canada stock forecast: Downside risk remains with C$279.65 support in focus

Royal Bank of Canada (RY) stock is trading at C$285.86, finishing the session down 2.29%. The stock remains below its short- and medium-term moving averages, suggesting ongoing seller pressure, yet still positions above longer-term averages.
 282.90
290.95
Highlights
- Royal Bank Of Canada submitted a Form 6-K to the SEC on November 5, 2026, maintaining cross-border compliance and U.S. market access.
- The disclosure ensures transparency for investors with interests in both Canadian and U.S. markets as broader selling persists.
- Shares of Royal Bank Of Canada closed at C$285.86, down 2.29%, with short-term selling prevailing and a trading range of C$279.65 to C$292.07 expected.
Regulatory disclosure supports US access amid sustained selling pressure
Royal Bank Of Canada filed a Form 6-K with the U.S. Securities and Exchange Commission on November 5, 2026, according to Fxtribune. This regulatory filing represents an official disclosure to U.S. authorities, ensuring compliance and transparency for investors with cross-border interests. The action maintains the company's access to U.S. capital markets, though price action has remained under broader selling pressure.
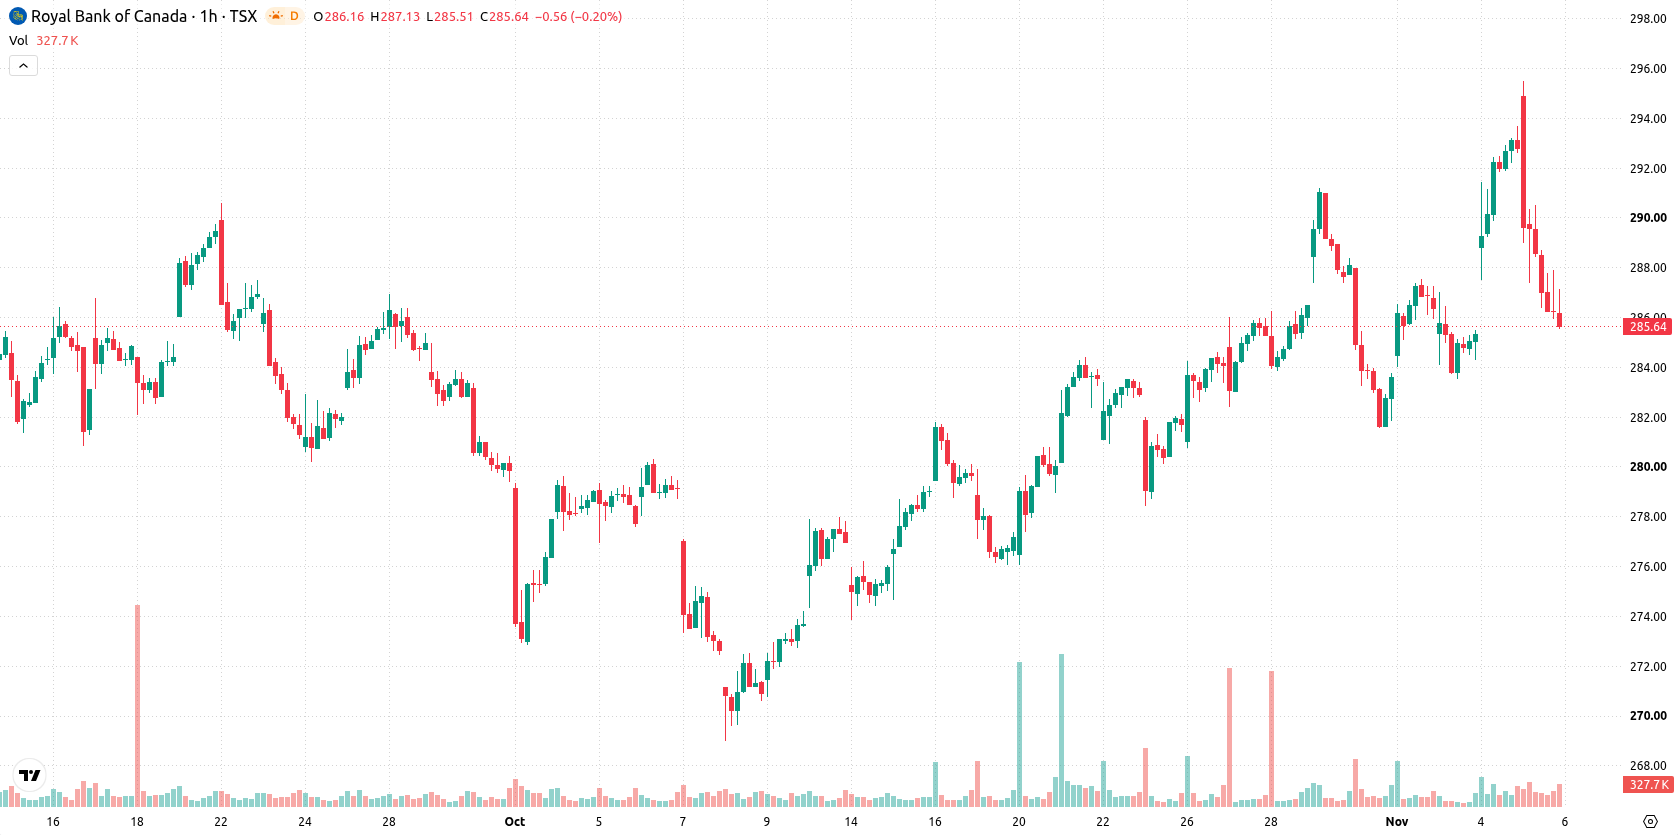
Bearish short-term bias as momentum weakens near resistance
On the hourly chart, RY is trading below both the MA-20 and MA-50, highlighting ongoing pressure from sellers in the short to medium term, while the stock remains above the MA-200, supporting a bullish long-term technical structure. The Ichimoku Kijun at C$289.51 serves as immediate resistance for any recovery attempts. Looking at momentum indicators, the MACD remains neutral and the ADX displays a sell bias. Both RSI and CCI are sitting in neutral zones, whereas Stoch RSI has entered its oversold zone, suggesting a risk of a short-term rebound. However, Bull/Bear Power is negative at -1.08, confirming that sellers dominate the intraday action.
Consolidation expected as downside risk edges higher
In the short term, the forecasted trading range for RY is expected to span from C$279.65 to C$292.07, reflecting typical volatility relative to current levels. The probability of an upward move stands at 45%, while a further decline remains slightly more likely at 55%. The baseline scenario anticipates the price consolidating within this range. Should RY break above C$289.51, further gains could be forthcoming, while a drop below C$279.65 would confirm ongoing weakness.
Earlier, analysts noted that Royal Bank of Canada maintained a bullish underlying structure despite facing immediate selling pressure and overbought signals. The current technical picture adds to this view by showing ongoing short- and medium-term weakness but persistent long-term strength, with the C$289.51 resistance level emerging as a key threshold to monitor for signs of a shift in direction.










-
 Afghanistan
-
 Albania
-
 Algeria
-
 Angola
-
 Argentina
-
 Armenia
-
 Australia
-
 Austria
-
 Azerbaijan
-
 Bahamas
-
 Bahrain
-
 Bangladesh
-
 Belarus
-
 Belgium
-
 Bolivia
-
 Botswana
-
 Brazil
-
 Brunei
-
 Bulgaria
-
 Cambodia
-
 Cameroon
-
 Canada
-
 Chile
-
 China
-
 Colombia
-
 Congo
-
 Costa Rica
-
 Cote d'Ivoire
-
 Croatia
-
 Cuba
-
 Cyprus
-
 Czechia
-
 DR Congo
-
 Denmark
-
 Dominican Republic
-
 Ecuador
-
 Egypt
-
 El Salvador
-
 Estonia
-
 Eswatini
-
 Ethiopia
-
 Finland
-
 France
-
 Georgia
-
 Germany
-
 Ghana
-
 Greece
-
 Haiti
-
 Hong Kong
-
 Hungary
-
 India
-
 Indonesia
-
 Iran, Islamic republic
-
 Iraq
-
 Ireland
-
 Israel
-
 Italy
-
 Jamaica
-
 Japan
-
 Jordan
-
 Kazakhstan
-
 Kenya
-
 Korea
-
 Kuwait
-
 Kyrgyzstan
-
 Laos
-
 Latvia
-
 Lebanon
-
 Lesotho
-
 Libya
-
 Lithuania
-
 Luxembourg
-
 Madagascar
-
 Malaysia
-
 Malta
-
 Mauritius
-
 Mexico
-
 Moldova
-
 Mongolia
-
 Montenegro
-
 Morocco
-
 Mozambique
-
 Myanmar
-
 Namibia
-
 Nepal
-
 Netherlands
-
 New Zealand
-
 Nigeria
-
 North Macedonia
-
 Norway
-
 Oman
-
 Pakistan
-
 Palestine
-
 Panama
-
 Papua New Guinea
-
 Paraguay
-
 Peru
-
 Philippines
-
 Poland
-
 Portugal
-
 Puerto Rico
-
 Qatar
-
 Reunion
-
 Romania
-
 Rwanda
-
 Saudi Arabia
-
 Serbia
-
 Singapore
-
 Slovakia
-
 Slovenia
-
 Somalia
-
 South Africa
-
 Spain
-
 Sri Lanka
-
 Sweden
-
 Switzerland
-
 Syria
-
 Taiwan
-
 Tajikistan
-
 Tanzania
-
 Thailand
-
 Trinidad and Tobago
-
 Tunisia
-
 Turkey
-
 UAE
-
 Uganda
-
 Ukraine
-
 United Kingdom
-
United States
-
 Uruguay
-
 Uzbekistan
-
 Venezuela
-
 Vietnam
-
 Yemen
-
 Zambia
-
 Zimbabwe
- Forex
- Crypto












