

Royal Bank of Canada trims climate and sustainability positions: Can RY regain investor confidence?

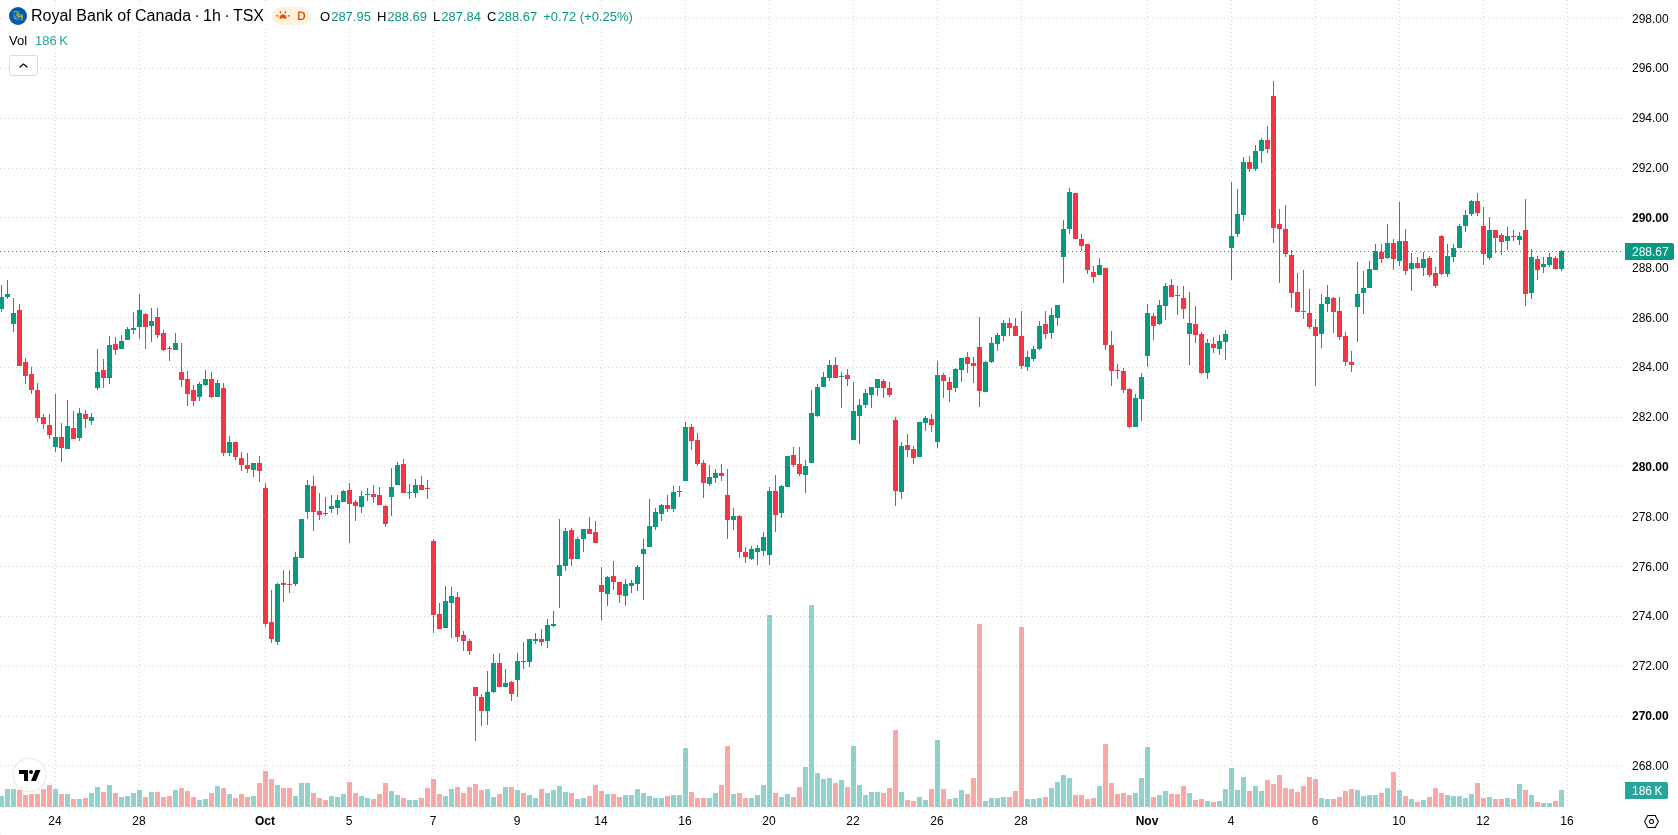
Royal Bank of Canada (RY) stock is trading at C$288.37, posting a modest decline on the day. The shares currently sit below their short-term moving average while remaining above other key longer-term moving averages, reflecting a mixed technical posture.
 289.69
290.95
Highlights
- Royal Bank of Canada has cut at least three senior roles responsible for climate, sustainability, and ESG functions.
- This downsizing signals a strategic shift away from sustainability governance at the executive level, raising uncertainty around the bank's approach to climate risk and ESG reporting.
- Shares of Royal Bank of Canada closed at C$288.37 with mixed short- to medium-term technical signals and are expected to trade between C$285.88 and C$290.86 over the next few days.
Sustainability focus cut as executive ESG roles eliminated
Royal Bank of Canada has eliminated at least three senior roles responsible for climate, sustainability, and ESG, according to Retailbankerinternational. This move points to a strategic reduction in emphasis on sustainability governance at the executive level, which could impact the bank’s standing with institutional investors focused on ESG criteria. The organizational change introduces fresh uncertainty around Royal Bank of Canada’s approach to climate risk management and sustainability reporting.
Neutral momentum and resistance at Kijun amid mixed technicals
RY is trading below the MA-20 but still above both the MA-50 and MA-200. The Ichimoku Kijun level at C$288.71 currently acts as immediate resistance. Oscillator readings including MACD, ADX, RSI, Stoch RSI, and CCI remain in neutral territory, while Bull/Bear Power is slightly positive at 0.18. The Awesome Oscillator is neutral, and overall, technical signals are mixed with moderate volatility observed.
Rangebound action likely as volatility shapes directional odds
Over the next 2–3 trading days, RY is likely to fluctuate within the C$285.88 to C$290.86 range based on typical volatility around current levels. There is a 61% probability of a move higher, while downside risk stands at 39%. A sideways scenario remains the baseline unless the price breaks above resistance near the Kijun level, which would trigger a bullish bias; a drop below the lower bound of the expected range would tilt the scenario bearish.
Previously it was reported that Royal Bank of Canada’s internal restructuring reflected a potential shift away from dedicated sustainability governance alongside a technically bullish bias. The current analysis introduces further evidence of reduced ESG emphasis while highlighting a mixed technical setup, suggesting investors should closely monitor the Kijun resistance level for the next directional move.










-
 Afghanistan
-
 Albania
-
 Algeria
-
 Angola
-
 Argentina
-
 Armenia
-
 Australia
-
 Austria
-
 Azerbaijan
-
 Bahamas
-
 Bahrain
-
 Bangladesh
-
 Belarus
-
 Belgium
-
 Bolivia
-
 Botswana
-
 Brazil
-
 Brunei
-
 Bulgaria
-
 Cambodia
-
 Cameroon
-
 Canada
-
 Chile
-
 China
-
 Colombia
-
 Congo
-
 Costa Rica
-
 Cote d'Ivoire
-
 Croatia
-
 Cuba
-
 Cyprus
-
 Czechia
-
 DR Congo
-
 Denmark
-
 Dominican Republic
-
 Ecuador
-
 Egypt
-
 El Salvador
-
 Estonia
-
 Eswatini
-
 Ethiopia
-
 Finland
-
 France
-
 Georgia
-
 Germany
-
 Ghana
-
 Greece
-
 Haiti
-
 Hong Kong
-
 Hungary
-
 India
-
 Indonesia
-
 Iran, Islamic republic
-
 Iraq
-
 Ireland
-
 Israel
-
 Italy
-
 Jamaica
-
 Japan
-
 Jordan
-
 Kazakhstan
-
 Kenya
-
 Korea
-
 Kuwait
-
 Kyrgyzstan
-
 Laos
-
 Latvia
-
 Lebanon
-
 Lesotho
-
 Libya
-
 Lithuania
-
 Luxembourg
-
 Madagascar
-
 Malaysia
-
 Malta
-
 Mauritius
-
 Mexico
-
 Moldova
-
 Mongolia
-
 Montenegro
-
 Morocco
-
 Mozambique
-
 Myanmar
-
 Namibia
-
 Nepal
-
 Netherlands
-
 New Zealand
-
 Nigeria
-
 North Macedonia
-
 Norway
-
 Oman
-
 Pakistan
-
 Palestine
-
 Panama
-
 Papua New Guinea
-
 Paraguay
-
 Peru
-
 Philippines
-
 Poland
-
 Portugal
-
 Puerto Rico
-
 Qatar
-
 Reunion
-
 Romania
-
 Rwanda
-
 Saudi Arabia
-
 Serbia
-
 Singapore
-
 Slovakia
-
 Slovenia
-
 Somalia
-
 South Africa
-
 Spain
-
 Sri Lanka
-
 Sweden
-
 Switzerland
-
 Syria
-
 Taiwan
-
 Tajikistan
-
 Tanzania
-
 Thailand
-
 Trinidad and Tobago
-
 Tunisia
-
 Turkey
-
 UAE
-
 Uganda
-
 Ukraine
-
 United Kingdom
-
United States
-
 Uruguay
-
 Uzbekistan
-
 Venezuela
-
 Vietnam
-
 Yemen
-
 Zambia
-
 Zimbabwe
- Forex
- Crypto












