

Enbridge shares technical analysis: Support pressure increases at C$66.07

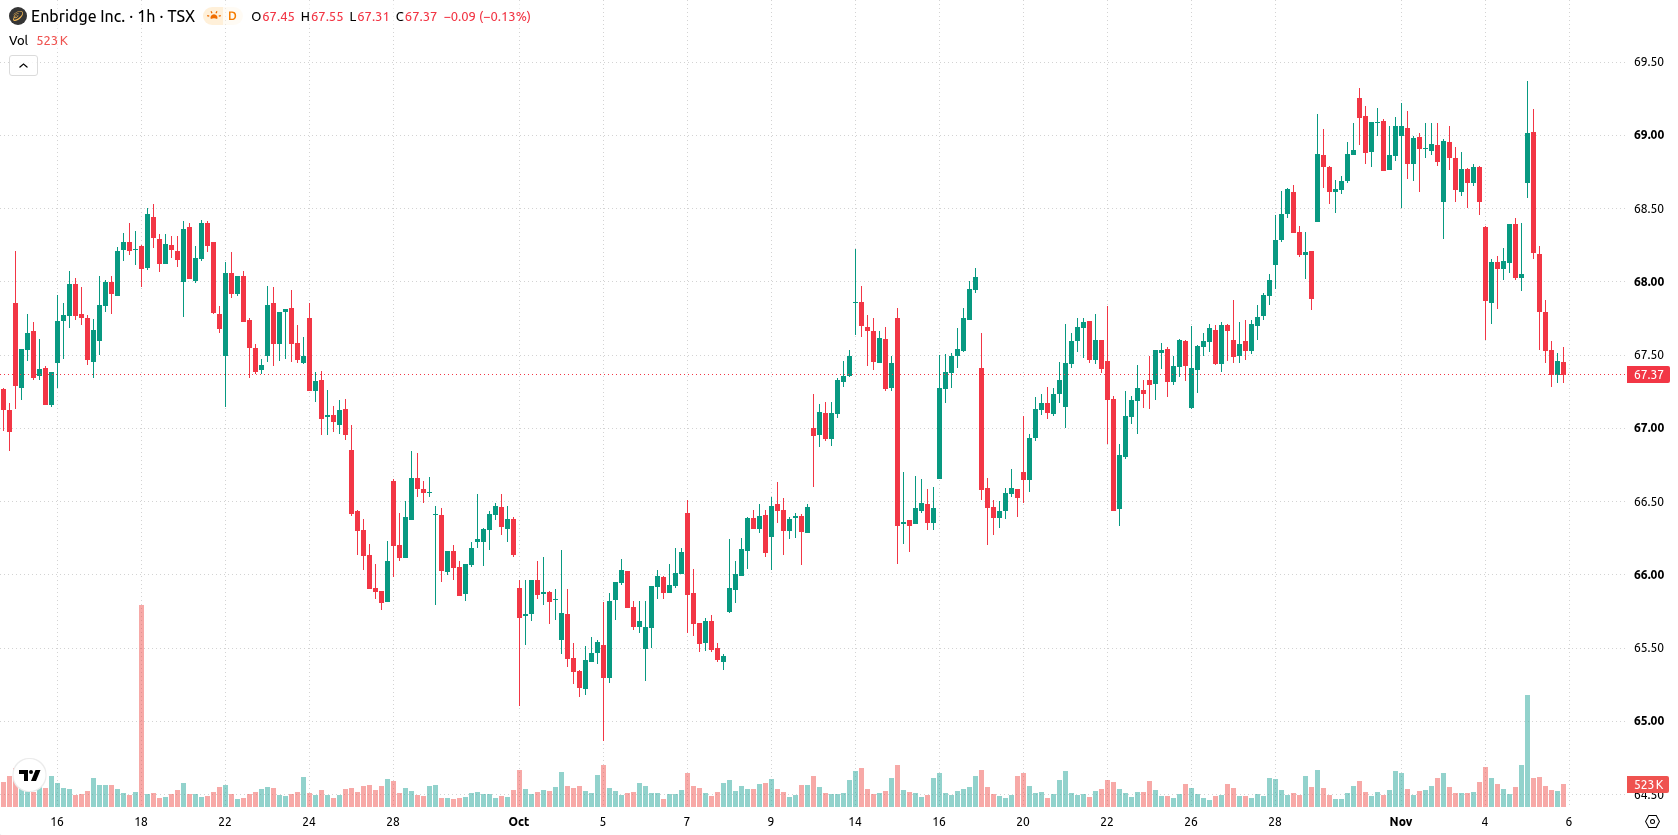
Enbridge (ENB) stock is trading at C$67.33, marking a daily decline of 1.07%. The price sits below its short-, medium-, and long-term moving averages, reflecting ongoing downward pressure.
 66.85
69.33
Highlights
- Enbridge reported a 4% year-over-year increase in adjusted EBITDA to C$4.4 billion for the third quarter of 2026 and reaffirmed its 2026 guidance.
- The company placed over C$3 billion in Gas Transmission projects into service, but its debt-to-EBITDA ratio rose to 5.1x, exceeding target levels.
- Shares of Enbridge fell 1.07% to C$67.33, trading below key moving averages with technical indicators signaling dominant short-term bearish momentum and a likely range of C$66.07 to C$68.26 in the next 2 to 3 trading days.
Mixed earnings strength as debt levels weigh on sentiment
Enbridge's third quarter 2026 results showed adjusted EBITDA rising 4% year-over-year to C$4.4 billion, as growth in Gas Transmission was partially offset by weakness in Liquids Pipelines, according to PR Newswire. The company reaffirmed its 2026 financial guidance and placed over C$3 billion worth of Gas Transmission projects into service during the period, reflecting continued strategic investment. However, Enbridge's debt-to-EBITDA ratio stands at 5.1x as it integrates new acquisitions, a level exceeding the company's target range and highlighting ongoing balance sheet risks. These developments provided some underlying support but have not prevented continued selling pressure in the stock.
Bearish momentum dominates as resistance and support remain tested
On the H1 timeframe, ENB is trading below its MA-20, MA-50, and MA-200, underscoring persistent bearish momentum across all examined periods. The Ichimoku Kijun level at C$68.33 serves as immediate resistance. Momentum remains negative, with both MACD and ADX in Sell mode, while the Awesome Oscillator also confirms prevailing bearish conditions. RSI is neutral, which contrasts with oversold readings from both Stochastic RSI and CCI, hinting at the potential for a near-term technical bounce. Bull/Bear Power is negative, confirming that sellers continue to dominate the intraday action.
High downside risk as immediate support threatens further losses
For the next 2–3 trading days, ENB is expected to trade within a typical volatility band of C$66.07 to C$68.26. The likelihood of further downside movement is high, with a 76% probability, while the chance of an upward rebound stands at 24%. If the price manages a close above the immediate resistance level, a short-term rebound may materialize. Conversely, a decisive break below current support is likely to accelerate the ongoing downward momentum.
Previously it was reported that Enbridge’s outlook was characterized by a stable dividend policy and technical resistance translating into limited directional bias for the stock. The latest analysis adds that persistent bearish momentum and an elevated debt-to-EBITDA ratio reinforce downside risks, making C$68.33 a critical resistance level to monitor for any potential shift in short-term trend.






Latest Enbridge News




-
 Afghanistan
-
 Albania
-
 Algeria
-
 Angola
-
 Argentina
-
 Armenia
-
 Australia
-
 Austria
-
 Azerbaijan
-
 Bahamas
-
 Bahrain
-
 Bangladesh
-
 Belarus
-
 Belgium
-
 Bolivia
-
 Botswana
-
 Brazil
-
 Brunei
-
 Bulgaria
-
 Cambodia
-
 Cameroon
-
 Canada
-
 Chile
-
 China
-
 Colombia
-
 Congo
-
 Costa Rica
-
 Cote d'Ivoire
-
 Croatia
-
 Cuba
-
 Cyprus
-
 Czechia
-
 DR Congo
-
 Denmark
-
 Dominican Republic
-
 Ecuador
-
 Egypt
-
 El Salvador
-
 Estonia
-
 Eswatini
-
 Ethiopia
-
 Finland
-
 France
-
 Georgia
-
 Germany
-
 Ghana
-
 Greece
-
 Haiti
-
 Hong Kong
-
 Hungary
-
 India
-
 Indonesia
-
 Iran, Islamic republic
-
 Iraq
-
 Ireland
-
 Israel
-
 Italy
-
 Jamaica
-
 Japan
-
 Jordan
-
 Kazakhstan
-
 Kenya
-
 Korea
-
 Kuwait
-
 Kyrgyzstan
-
 Laos
-
 Latvia
-
 Lebanon
-
 Lesotho
-
 Libya
-
 Lithuania
-
 Luxembourg
-
 Madagascar
-
 Malaysia
-
 Malta
-
 Mauritius
-
 Mexico
-
 Moldova
-
 Mongolia
-
 Montenegro
-
 Morocco
-
 Mozambique
-
 Myanmar
-
 Namibia
-
 Nepal
-
 Netherlands
-
 New Zealand
-
 Nigeria
-
 North Macedonia
-
 Norway
-
 Oman
-
 Pakistan
-
 Palestine
-
 Panama
-
 Papua New Guinea
-
 Paraguay
-
 Peru
-
 Philippines
-
 Poland
-
 Portugal
-
 Puerto Rico
-
 Qatar
-
 Reunion
-
 Romania
-
 Rwanda
-
 Saudi Arabia
-
 Serbia
-
 Singapore
-
 Slovakia
-
 Slovenia
-
 Somalia
-
 South Africa
-
 Spain
-
 Sri Lanka
-
 Sweden
-
 Switzerland
-
 Syria
-
 Taiwan
-
 Tajikistan
-
 Tanzania
-
 Thailand
-
 Trinidad and Tobago
-
 Tunisia
-
 Turkey
-
 UAE
-
 Uganda
-
 Ukraine
-
 United Kingdom
-
United States
-
 Uruguay
-
 Uzbekistan
-
 Venezuela
-
 Vietnam
-
 Yemen
-
 Zambia
-
 Zimbabwe
- Forex
- Crypto












