

Enbridge delivers strong earnings and adds assets: ENB support comes under pressure

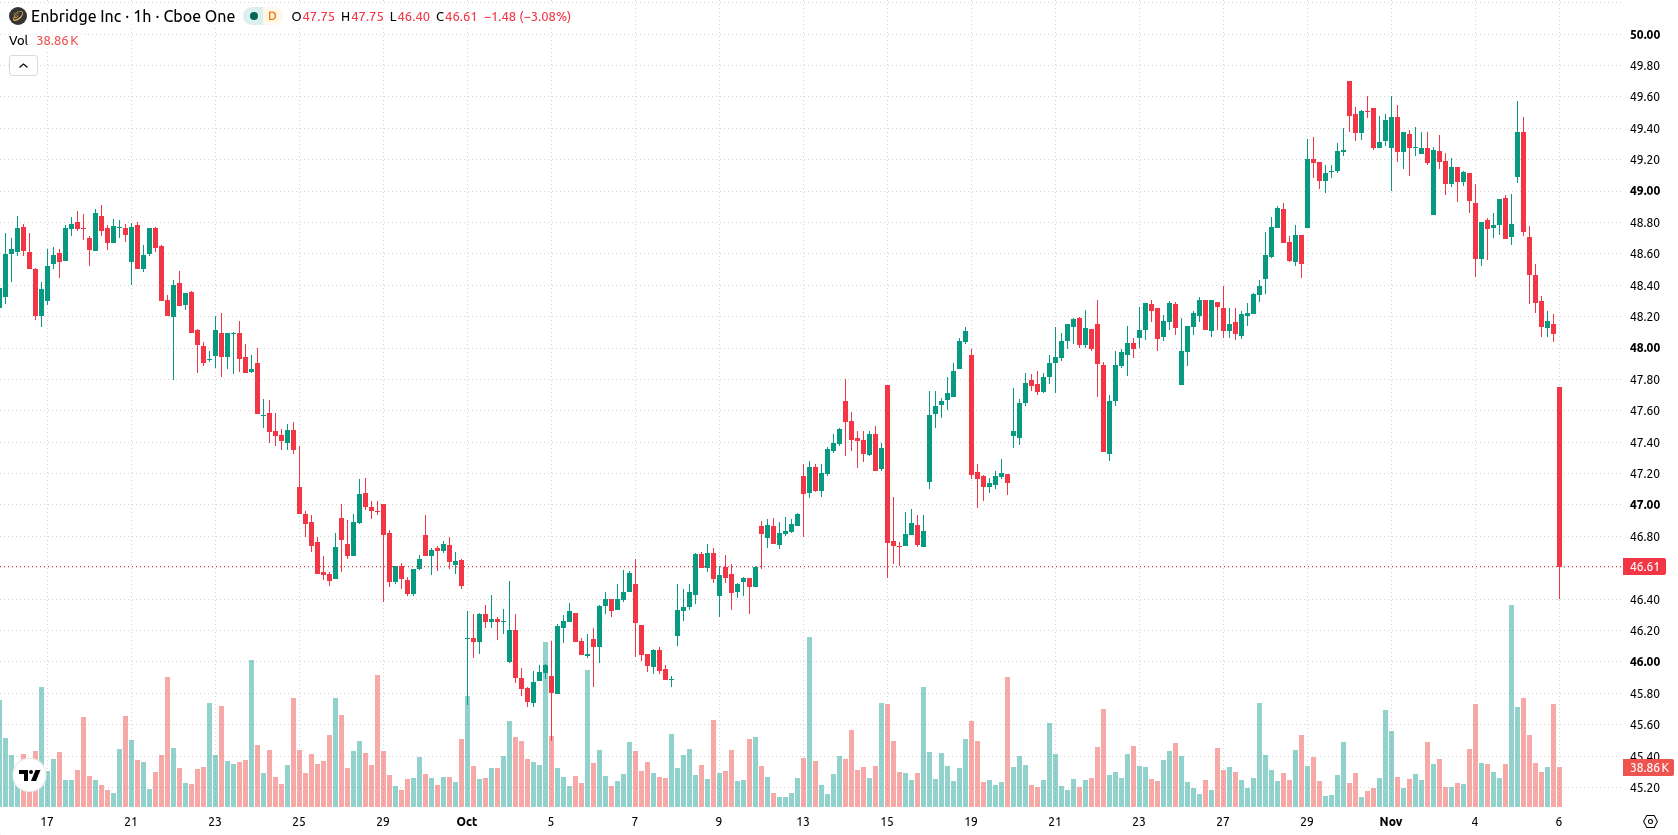
Enbridge Inc. (ENB) stock is trading at $46.39 after a 3.55% decline on the day. The price remains below its key short- and long-term moving averages, reflecting continued downside pressure.
 47.75
49.58
Highlights
- Enbridge reported Q3 2026 adjusted EBITDA rose 4% year over year to $4.4 billion, driven by Gas Transmission earnings growth.
- The company placed over $3 billion of Gas Transmission projects into service and expanded its footprint through acquisitions valued at $3.2 billion.
- Shares of Enbridge trade in a sustained downtrend below key moving averages, with high volatility and an expected range of $45.7 to $47.61 for the coming days.
Asset expansions and leadership change as elevated leverage persists
Enbridge reported a 4% year-over-year increase in Q3 2026 adjusted EBITDA to $4.4 billion, reflecting earnings growth in its Gas Transmission segment, as detailed by Panabee and Yahoo Finance. The company also placed more than $3 billion worth of Gas Transmission projects into service during the quarter, expanding its regulated asset base, while recent acquisitions of Tallgrass Energy’s crude oil business for $2.6 billion and Salt Creek Midstream’s gathering assets for $0.6 billion further broadened its North American footprint. Management reaffirmed its 2026 guidance and declared a quarterly dividend of C$0.97 per share, with CEO Greg Ebel set to retire in early 2027 as Enbridge manages elevated leverage, according to Yahoo Finance and Panabee. These developments outline a fundamentally active period for the company, though price action has remained under broader selling pressure.
Sell signals and oversold readings as technical barriers hold
ENB is trading below the MA-20 at $48.76 and MA-50 at $48.98 on the H1 timeframe, and also below the long-term MA-200 at $52.26 on the daily chart. The Ichimoku Kijun level at $48.81 marks immediate resistance. Technical indicators show momentum remains weak, with both MACD and ADX signaling a sell bias, while Bull/Bear Power is negative at -0.34 and the Awesome Oscillator confirms the downtrend. RSI sits in the neutral zone, and both Stochastic RSI and CCI are in oversold territory, indicating the potential for an upside rebound but not yet confirming a reversal.
Range-bound outlook as downside risk outweighs bullish scenarios
Over the next several days, ENB is expected to trade between $45.7 and $47.61 as typical volatility. There is a 24% probability of an upside move, while a downside scenario is more likely at 76%. The baseline expectation is for price consolidation within this narrow corridor. A sustained advance would require a break above immediate resistance, whereas a close below current support could invite further selling.
Earlier, analysts noted that persistent bearish momentum and elevated leverage continued to weigh on Enbridge’s outlook. The current technical setup supports this view, highlighting $48.81 as a key resistance level to monitor for any potential shift in trend.






Latest Enbridge News




-
 Afghanistan
-
 Albania
-
 Algeria
-
 Angola
-
 Argentina
-
 Armenia
-
 Australia
-
 Austria
-
 Azerbaijan
-
 Bahamas
-
 Bahrain
-
 Bangladesh
-
 Belarus
-
 Belgium
-
 Bolivia
-
 Botswana
-
 Brazil
-
 Brunei
-
 Bulgaria
-
 Cambodia
-
 Cameroon
-
 Canada
-
 Chile
-
 China
-
 Colombia
-
 Congo
-
 Costa Rica
-
 Cote d'Ivoire
-
 Croatia
-
 Cuba
-
 Cyprus
-
 Czechia
-
 DR Congo
-
 Denmark
-
 Dominican Republic
-
 Ecuador
-
 Egypt
-
 El Salvador
-
 Estonia
-
 Eswatini
-
 Ethiopia
-
 Finland
-
 France
-
 Georgia
-
 Germany
-
 Ghana
-
 Greece
-
 Haiti
-
 Hong Kong
-
 Hungary
-
 India
-
 Indonesia
-
 Iran, Islamic republic
-
 Iraq
-
 Ireland
-
 Israel
-
 Italy
-
 Jamaica
-
 Japan
-
 Jordan
-
 Kazakhstan
-
 Kenya
-
 Korea
-
 Kuwait
-
 Kyrgyzstan
-
 Laos
-
 Latvia
-
 Lebanon
-
 Lesotho
-
 Libya
-
 Lithuania
-
 Luxembourg
-
 Madagascar
-
 Malaysia
-
 Malta
-
 Mauritius
-
 Mexico
-
 Moldova
-
 Mongolia
-
 Montenegro
-
 Morocco
-
 Mozambique
-
 Myanmar
-
 Namibia
-
 Nepal
-
 Netherlands
-
 New Zealand
-
 Nigeria
-
 North Macedonia
-
 Norway
-
 Oman
-
 Pakistan
-
 Palestine
-
 Panama
-
 Papua New Guinea
-
 Paraguay
-
 Peru
-
 Philippines
-
 Poland
-
 Portugal
-
 Puerto Rico
-
 Qatar
-
 Reunion
-
 Romania
-
 Rwanda
-
 Saudi Arabia
-
 Serbia
-
 Singapore
-
 Slovakia
-
 Slovenia
-
 Somalia
-
 South Africa
-
 Spain
-
 Sri Lanka
-
 Sweden
-
 Switzerland
-
 Syria
-
 Taiwan
-
 Tajikistan
-
 Tanzania
-
 Thailand
-
 Trinidad and Tobago
-
 Tunisia
-
 Turkey
-
 UAE
-
 Uganda
-
 Ukraine
-
 United Kingdom
-
United States
-
 Uruguay
-
 Uzbekistan
-
 Venezuela
-
 Vietnam
-
 Yemen
-
 Zambia
-
 Zimbabwe
- Forex
- Crypto












