

S&P 500 technical analysis: Oversold CCI and Stoch RSI hint at rebound potential

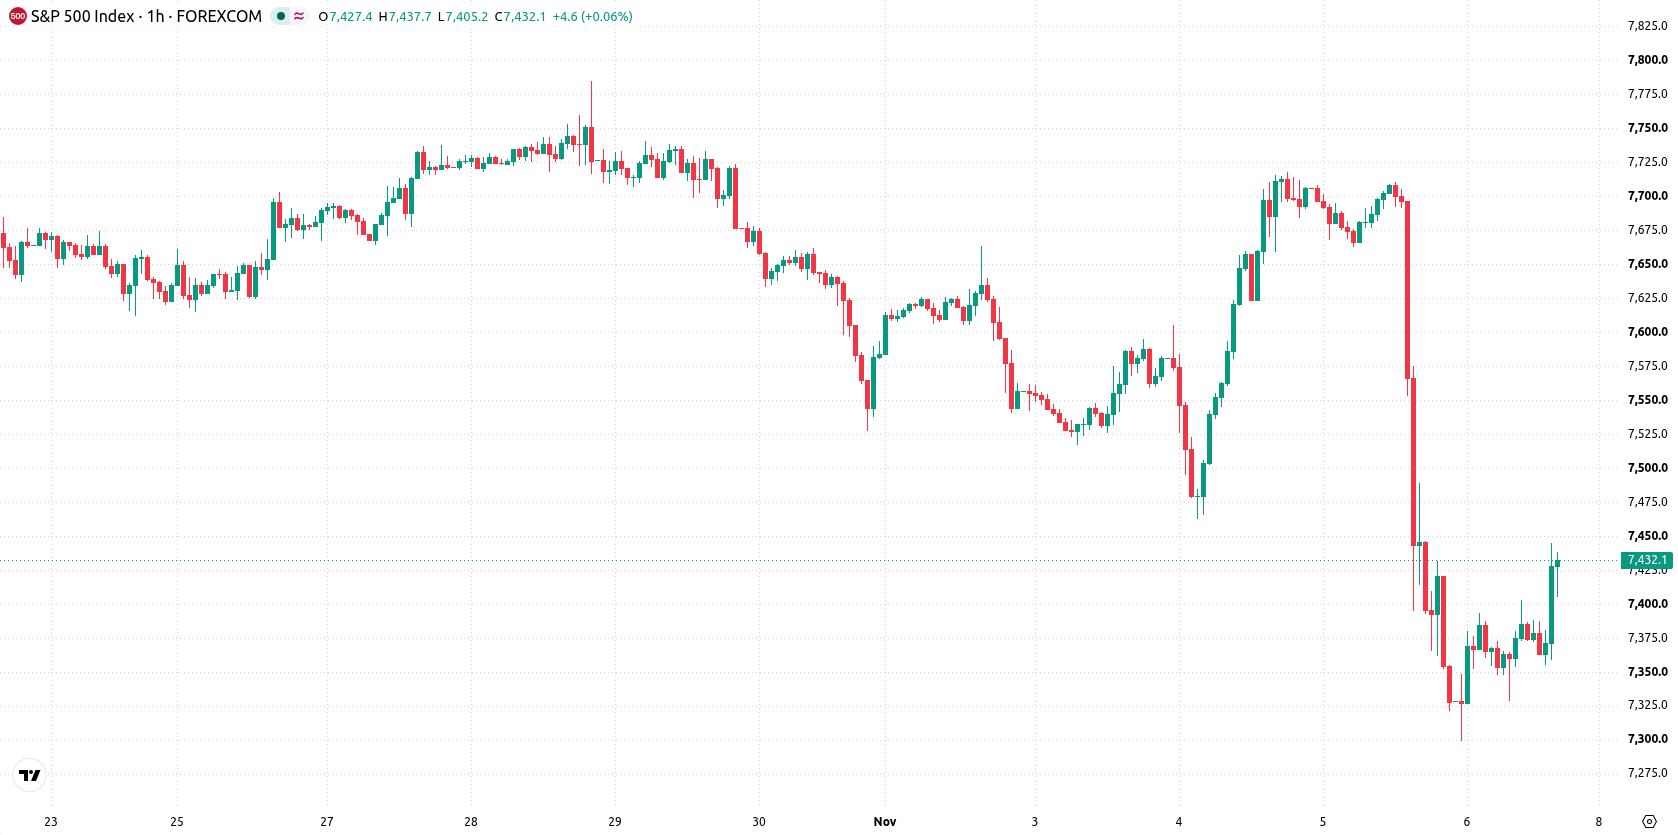
S&P 500 (SPX) is trading at 7,429, having gained 1.03% on the day. The index remains below its key short- and medium-term moving averages, but it trades above the long-term average support level during a high-volatility session.
 7617.27
7649.65
Highlights
- SPDR S&P 500 ETF Trust saw a 5.39 billion net outflow, indicating large institutional adjustments in S&P 500 exposure.
- The scale of redemptions suggests decreased ETF liquidity and increased vulnerability in index stability amid shifting positions.
- SPX trades below short- and medium-term moving averages, with prevailing bearish momentum and a projected range of 7,348 to 7,509 for the next sessions.
Institutional outflows drive S&P 500 ETF liquidity drop amid sentiment shift
A major development for the S&P 500 was the $5.39 billion net outflow from the SPDR S&P 500 ETF Trust (SPY) on November 4, as reported by Yahoo Finance. This large-scale redemption indicates significant institutional portfolio adjustments and results in decreased ETF liquidity, which can directly affect underlying index stability. The depth of position trimming points to participants moving assets out of S&P 500 exposure amid shifting market sentiment.
Oversold momentum and key resistance highlight technical stress and rebound risk
Technically, SPX is trading below the MA-20 and MA-50, with the long-term MA-200 remaining as a support base. The Ichimoku Kijun level at 7,534 is acting as immediate resistance. Momentum signals, including MACD and ADX, continue to indicate selling pressure. Oscillators such as RSI, Stochastic RSI, and CCI are now in oversold conditions, hinting at possible exhaustion among sellers and raising the probability of a near-term rebound attempt. However, Bull/Bear Power and the Awesome Oscillator remain firmly negative, supporting persistent intraday bearishness.
Bearish tilt persists as projected range reflects rebound potential
In the next two to three sessions, SPX is projected to trade within a 7,348 to 7,509 volatility band relative to current levels. The probability of additional downside is estimated at 70%, suggesting sellers retain an advantage, though the severely oversold conditions increase the chance of a technical rebound. For a bullish scenario, SPX would need to break above the 7,534 resistance level to confirm renewed buyer strength. Conversely, a decisive move below 7,348 would open the way for further losses.
Earlier, analysts noted that the S&P 500 was contending with notable short- and medium-term technical weakness despite fundamentally strong sector earnings. The current analysis adds that significant ETF outflows and oversold technical conditions now heighten the focus on the 7,534 resistance level as a potential inflection point in the days ahead.













-
 Afghanistan
-
 Albania
-
 Algeria
-
 Angola
-
 Argentina
-
 Armenia
-
 Australia
-
 Austria
-
 Azerbaijan
-
 Bahamas
-
 Bahrain
-
 Bangladesh
-
 Belarus
-
 Belgium
-
 Bolivia
-
 Botswana
-
 Brazil
-
 Brunei
-
 Bulgaria
-
 Cambodia
-
 Cameroon
-
 Canada
-
 Chile
-
 China
-
 Colombia
-
 Congo
-
 Costa Rica
-
 Cote d'Ivoire
-
 Croatia
-
 Cuba
-
 Cyprus
-
 Czechia
-
 DR Congo
-
 Denmark
-
 Dominican Republic
-
 Ecuador
-
 Egypt
-
 El Salvador
-
 Estonia
-
 Eswatini
-
 Ethiopia
-
 Finland
-
 France
-
 Georgia
-
 Germany
-
 Ghana
-
 Greece
-
 Haiti
-
 Hong Kong
-
 Hungary
-
 India
-
 Indonesia
-
 Iran, Islamic republic
-
 Iraq
-
 Ireland
-
 Israel
-
 Italy
-
 Jamaica
-
 Japan
-
 Jordan
-
 Kazakhstan
-
 Kenya
-
 Korea
-
 Kuwait
-
 Kyrgyzstan
-
 Laos
-
 Latvia
-
 Lebanon
-
 Lesotho
-
 Libya
-
 Lithuania
-
 Luxembourg
-
 Madagascar
-
 Malaysia
-
 Malta
-
 Mauritius
-
 Mexico
-
 Moldova
-
 Mongolia
-
 Montenegro
-
 Morocco
-
 Mozambique
-
 Myanmar
-
 Namibia
-
 Nepal
-
 Netherlands
-
 New Zealand
-
 Nigeria
-
 North Macedonia
-
 Norway
-
 Oman
-
 Pakistan
-
 Palestine
-
 Panama
-
 Papua New Guinea
-
 Paraguay
-
 Peru
-
 Philippines
-
 Poland
-
 Portugal
-
 Puerto Rico
-
 Qatar
-
 Reunion
-
 Romania
-
 Rwanda
-
 Saudi Arabia
-
 Serbia
-
 Singapore
-
 Slovakia
-
 Slovenia
-
 Somalia
-
 South Africa
-
 Spain
-
 Sri Lanka
-
 Sweden
-
 Switzerland
-
 Syria
-
 Taiwan
-
 Tajikistan
-
 Tanzania
-
 Thailand
-
 Trinidad and Tobago
-
 Tunisia
-
 Turkey
-
 UAE
-
 Uganda
-
 Ukraine
-
 United Kingdom
-
United States
-
 Uruguay
-
 Uzbekistan
-
 Venezuela
-
 Vietnam
-
 Yemen
-
 Zambia
-
 Zimbabwe
- Forex
- Crypto












