

Earnings event approaches as Nvidia stock holds gains after heavy selling

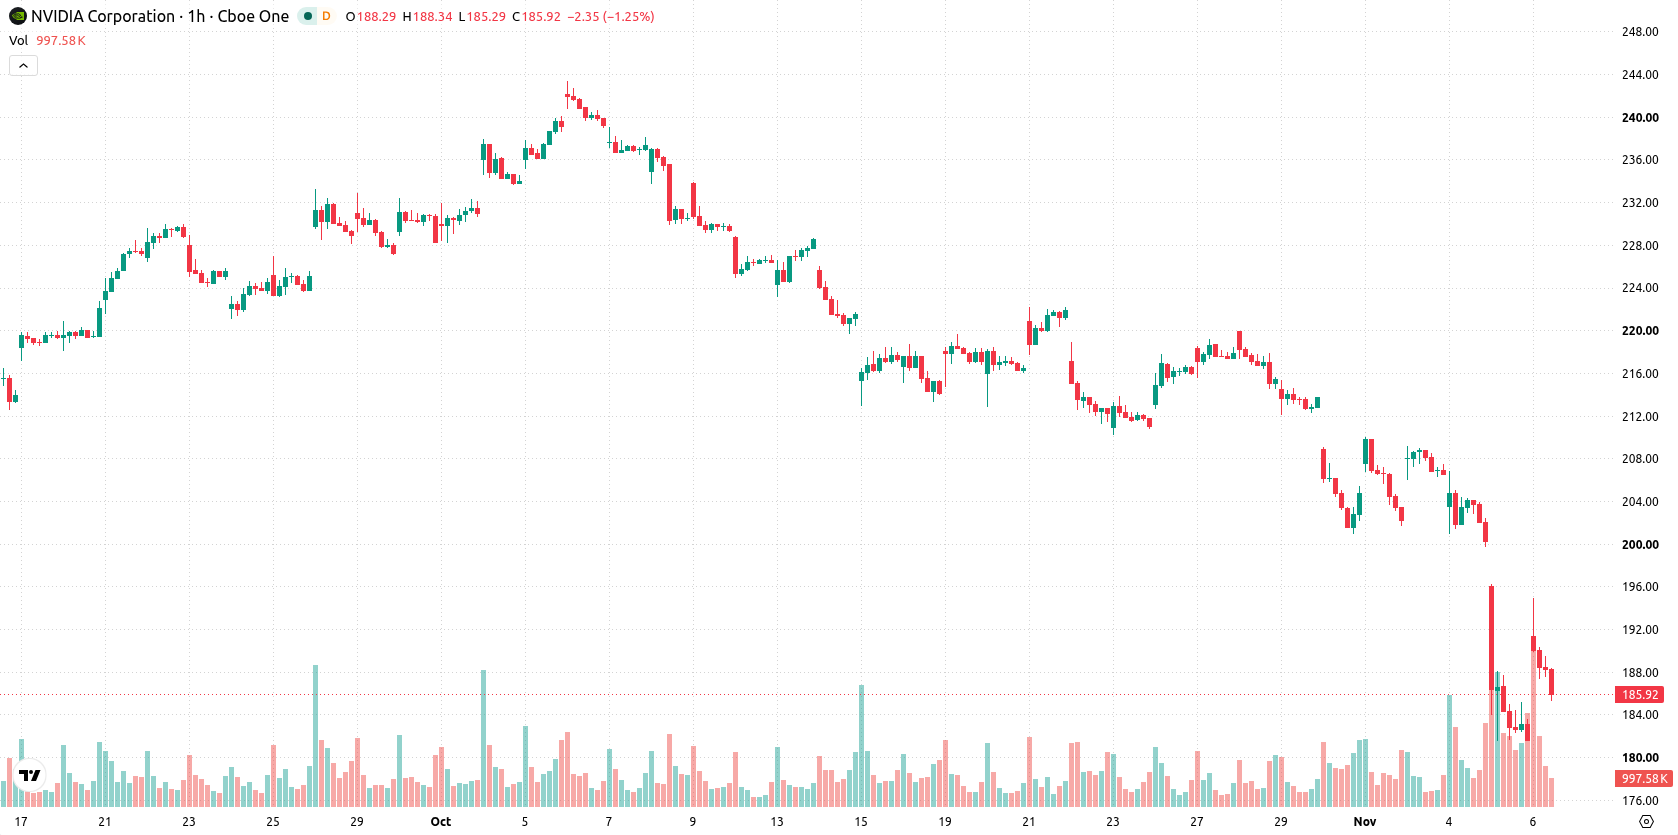
Nvidia (NVDA) stock is trading at $186.04, up 2.45% on the day. The price sits near the top of today's range and remains below its key moving averages, reflecting high volatility following a sharp intraday rebound.
 194.90
209.95
Highlights
- Nvidia stock fell 9.3% on November 5, 2026, erasing $1.4 trillion in market value due to renewed regulatory concerns.
- Investors face increased uncertainty ahead of Nvidia's November 17 earnings report as focus shifts to operational and regulatory developments.
- Technical signals confirm ongoing bearish momentum, with the price expected to range between $173.34 and $198.74 in coming sessions.
Record sell-off and regulatory fears drive caution ahead of earnings
Recent trading in Nvidia is shaped by the sharp 9.3% share price drop on November 5, 2026, which erased approximately $1.4 trillion in market value, according to Finance Biggo. This abrupt move, also identified as the stock's largest one-day decline in a year by Trefis, has heightened volatility and increased caution among market participants. The downturn is mainly attributed to renewed investor concerns over potential U.S. regulatory actions affecting AI infrastructure and data center projects following the midterm elections, as noted by 247wallst. Looking ahead, the upcoming quarterly earnings report scheduled for November 17, 2026, adds further event-driven uncertainty as investors weigh both operational performance and the evolving regulatory outlook.
Weak momentum and oversold signals as major resistance holds
NVDA/USD is currently positioned below the MA-20 and MA-50 on the hourly chart and sits beneath the MA-200 on the daily timeframe. The Ichimoku Kijun level at $195 remains a key resistance area, while support is found at $173.34, with the immediate technical range capped at $198.74. Both MACD and ADX confirm weak momentum, and the presence of RSI, Stoch RSI, and CCI in oversold zones increases the likelihood of a short-term rebound. However, Bull/Bear Power is negative, indicating sustained seller dominance as volatility remains heightened.
Sideways bias prevails amid bearish risks within defined range
Over the next several sessions, NVDA/USD is expected to trade within a volatility band between $173.34 and $198.74. There is a 73% probability of further downside amid prevailing negative momentum, with any potential recovery scenarios hinging on a sustained breakout above $195 resistance. If selling resumes below $173.34, this would confirm a bearish extension, while a sideways consolidation remains the most probable short-term scenario.
Earlier, analysts noted that heightened scrutiny of the AI sector and policy uncertainty had pressured Nvidia shares, with technical signals indicating a continued bearish trend. With the current price action amplifying volatility and downside risks following the sharp post-election decline, traders should closely monitor the $195 resistance for any signs of reversal and $173.34 support for potential bearish continuation.






Latest NVIDIA News



-
 Afghanistan
-
 Albania
-
 Algeria
-
 Angola
-
 Argentina
-
 Armenia
-
 Australia
-
 Austria
-
 Azerbaijan
-
 Bahamas
-
 Bahrain
-
 Bangladesh
-
 Belarus
-
 Belgium
-
 Bolivia
-
 Botswana
-
 Brazil
-
 Brunei
-
 Bulgaria
-
 Cambodia
-
 Cameroon
-
 Canada
-
 Chile
-
 China
-
 Colombia
-
 Congo
-
 Costa Rica
-
 Cote d'Ivoire
-
 Croatia
-
 Cuba
-
 Cyprus
-
 Czechia
-
 DR Congo
-
 Denmark
-
 Dominican Republic
-
 Ecuador
-
 Egypt
-
 El Salvador
-
 Estonia
-
 Eswatini
-
 Ethiopia
-
 Finland
-
 France
-
 Georgia
-
 Germany
-
 Ghana
-
 Greece
-
 Haiti
-
 Hong Kong
-
 Hungary
-
 India
-
 Indonesia
-
 Iran, Islamic republic
-
 Iraq
-
 Ireland
-
 Israel
-
 Italy
-
 Jamaica
-
 Japan
-
 Jordan
-
 Kazakhstan
-
 Kenya
-
 Korea
-
 Kuwait
-
 Kyrgyzstan
-
 Laos
-
 Latvia
-
 Lebanon
-
 Lesotho
-
 Libya
-
 Lithuania
-
 Luxembourg
-
 Madagascar
-
 Malaysia
-
 Malta
-
 Mauritius
-
 Mexico
-
 Moldova
-
 Mongolia
-
 Montenegro
-
 Morocco
-
 Mozambique
-
 Myanmar
-
 Namibia
-
 Nepal
-
 Netherlands
-
 New Zealand
-
 Nigeria
-
 North Macedonia
-
 Norway
-
 Oman
-
 Pakistan
-
 Palestine
-
 Panama
-
 Papua New Guinea
-
 Paraguay
-
 Peru
-
 Philippines
-
 Poland
-
 Portugal
-
 Puerto Rico
-
 Qatar
-
 Reunion
-
 Romania
-
 Rwanda
-
 Saudi Arabia
-
 Serbia
-
 Singapore
-
 Slovakia
-
 Slovenia
-
 Somalia
-
 South Africa
-
 Spain
-
 Sri Lanka
-
 Sweden
-
 Switzerland
-
 Syria
-
 Taiwan
-
 Tajikistan
-
 Tanzania
-
 Thailand
-
 Trinidad and Tobago
-
 Tunisia
-
 Turkey
-
 UAE
-
 Uganda
-
 Ukraine
-
 United Kingdom
-
United States
-
 Uruguay
-
 Uzbekistan
-
 Venezuela
-
 Vietnam
-
 Yemen
-
 Zambia
-
 Zimbabwe
- Forex
- Crypto












