

National Grid stock consolidates as sellers maintain pressure despite improved earnings and higher dividend

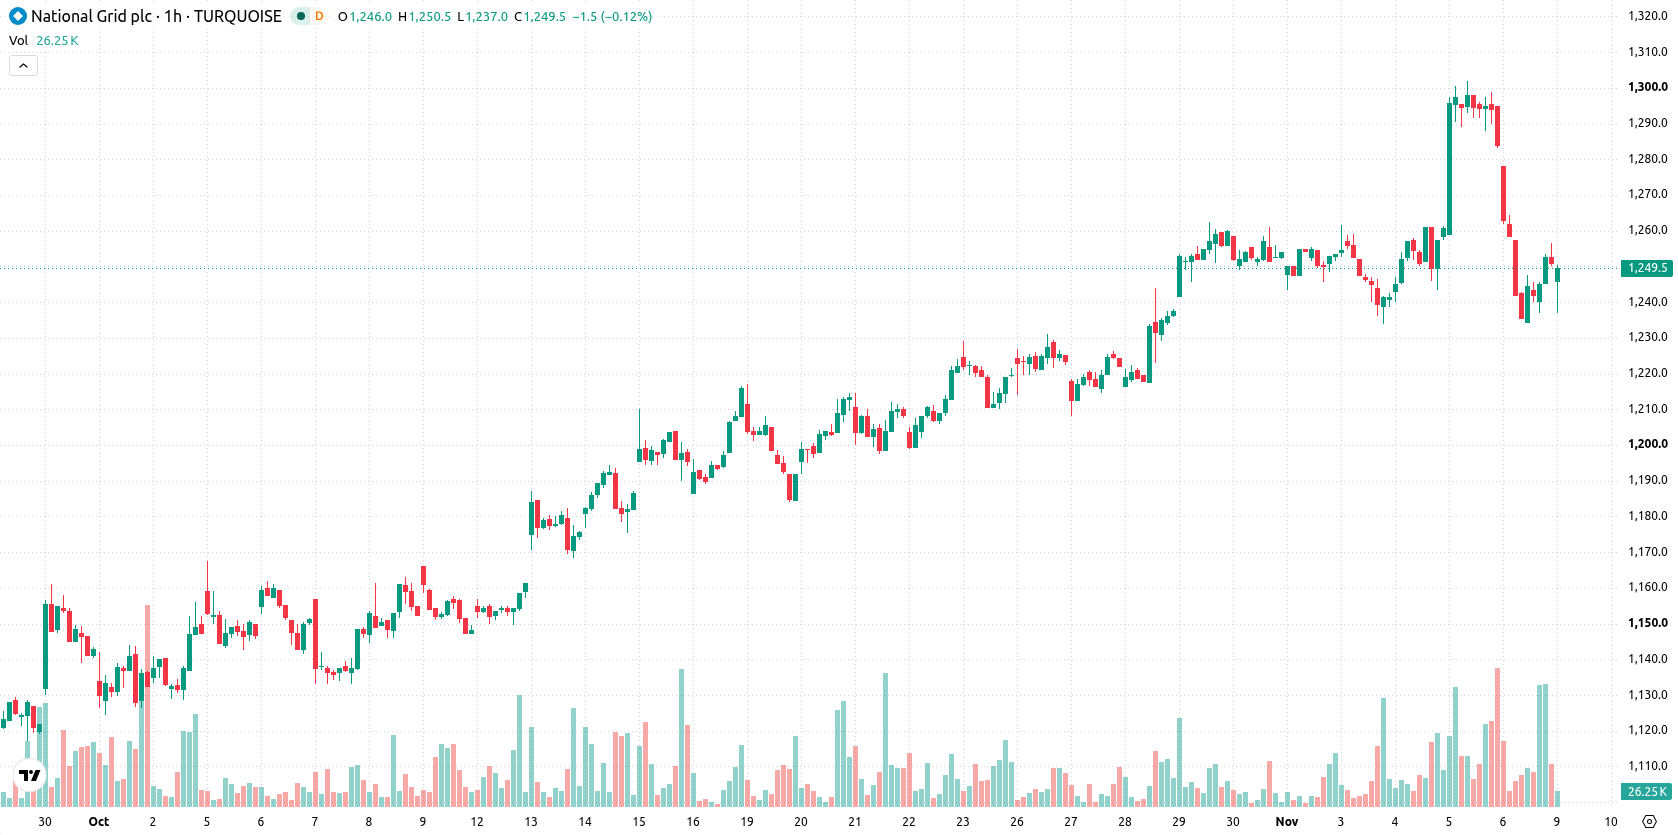
National Grid (NG) stock is trading at GBX1,250.50, showing a marginal decline for the session. The price sits below its key short- and medium-term moving averages but remains above longer-term trend indicators.
 1260.50
1302.50
Highlights
- National Grid raised its fiscal 2027 capital investment plan to approximately £13.5 billion, committing £6.7 billion in infrastructure spending during the first half.
- Underlying EPS climbed 22% and operational cash generation increased 14% to £4.1 billion, with net debt rising £4.5 billion to £48.6 billion.
- National Grid stock trades below short- and medium-term moving averages with bearish technical signals and a projected range of GBX1,219 to GBX1,281 for the next sessions.
Profitability boosts cash flow but higher debt follows investment surge
National Grid increased its capital investment plans, raising its fiscal 2027 forecast to approximately £13.5 billion and completing £6.7 billion in capital expenditure during the first half, indicating an ongoing intensive upgrade to its infrastructure, according to Yahoo Finance. The company also recorded a 22% rise in underlying EPS for the first half, reflecting improved profitability and capacity to internally fund operations. Alongside this, the board declared a higher interim dividend of £0.1697 per share, while operational cash generation climbed 14% to £4.1 billion; however, net debt rose by £4.5 billion to £48.6 billion due to capital spending and related outflows.
Short-term bearish bias as technical resistance contains weakness
NG is trading below MA-20 at GBX1,269 and MA-50 at GBX1,258, but holds above the MA-200 at GBX1,239. The Ichimoku Kijun at GBX1,268 acts as an immediate resistance level. Momentum remains weak, with both MACD and ADX showing bearish cues, and Bull/Bear Power at -6.6 indicating intraday seller control. Oscillators such as RSI (42.7), Stoch RSI (26.73), and CCI (-76.23) are all within neutral ranges, while the Awesome Oscillator remains neutral.
Downside risk dominates as rangebound outlook persists
In the short term, NG is expected to fluctuate between GBX1,219 and GBX1,281, reflecting a typical volatility band relative to current levels. The probability of an upward move stands at 43%, with downside seen as more likely at 57%. If the price remains rangebound, consolidation can be expected between current support and resistance levels. A breakout above GBX1,268 could open a path for recovery, while a move below GBX1,219 would likely trigger additional losses.
Earlier, analysts noted that National Grid’s strong operational performance and upgraded outlook were supporting a generally positive long-term trend, balanced by near-term technical weakness. The latest data reinforce this view, highlighting that while the stock remains above key long-term supports, downside risk is elevated and a move below GBX1,219 could signal a further bearish leg.









-
 Afghanistan
-
 Albania
-
 Algeria
-
 Angola
-
 Argentina
-
 Armenia
-
 Australia
-
 Austria
-
 Azerbaijan
-
 Bahamas
-
 Bahrain
-
 Bangladesh
-
 Belarus
-
 Belgium
-
 Bolivia
-
 Botswana
-
 Brazil
-
 Brunei
-
 Bulgaria
-
 Cambodia
-
 Cameroon
-
 Canada
-
 Chile
-
 China
-
 Colombia
-
 Congo
-
 Costa Rica
-
 Cote d'Ivoire
-
 Croatia
-
 Cuba
-
 Cyprus
-
 Czechia
-
 DR Congo
-
 Denmark
-
 Dominican Republic
-
 Ecuador
-
 Egypt
-
 El Salvador
-
 Estonia
-
 Eswatini
-
 Ethiopia
-
 Finland
-
 France
-
 Georgia
-
 Germany
-
 Ghana
-
 Greece
-
 Haiti
-
 Hong Kong
-
 Hungary
-
 India
-
 Indonesia
-
 Iran, Islamic republic
-
 Iraq
-
 Ireland
-
 Israel
-
 Italy
-
 Jamaica
-
 Japan
-
 Jordan
-
 Kazakhstan
-
 Kenya
-
 Korea
-
 Kuwait
-
 Kyrgyzstan
-
 Laos
-
 Latvia
-
 Lebanon
-
 Lesotho
-
 Libya
-
 Lithuania
-
 Luxembourg
-
 Madagascar
-
 Malaysia
-
 Malta
-
 Mauritius
-
 Mexico
-
 Moldova
-
 Mongolia
-
 Montenegro
-
 Morocco
-
 Mozambique
-
 Myanmar
-
 Namibia
-
 Nepal
-
 Netherlands
-
 New Zealand
-
 Nigeria
-
 North Macedonia
-
 Norway
-
 Oman
-
 Pakistan
-
 Palestine
-
 Panama
-
 Papua New Guinea
-
 Paraguay
-
 Peru
-
 Philippines
-
 Poland
-
 Portugal
-
 Puerto Rico
-
 Qatar
-
 Reunion
-
 Romania
-
 Rwanda
-
 Saudi Arabia
-
 Serbia
-
 Singapore
-
 Slovakia
-
 Slovenia
-
 Somalia
-
 South Africa
-
 Spain
-
 Sri Lanka
-
 Sweden
-
 Switzerland
-
 Syria
-
 Taiwan
-
 Tajikistan
-
 Tanzania
-
 Thailand
-
 Trinidad and Tobago
-
 Tunisia
-
 Turkey
-
 UAE
-
 Uganda
-
 Ukraine
-
 United Kingdom
-
United States
-
 Uruguay
-
 Uzbekistan
-
 Venezuela
-
 Vietnam
-
 Yemen
-
 Zambia
-
 Zimbabwe
- Forex
- Crypto












