

Royal Bank of Canada shares technical analysis: Weak momentum meets consolidation near resistance

Royal Bank of Canada (RY) stock is trading at C$284.16 after a modest decline today. The price sits below its key short- and medium-term moving averages but remains above the long-term average, indicating recent pressure within a broader supportive structure.
 290.32
290.95
Highlights
- Royal Bank of Canada will acquire full ownership of Yarra Capital Management to expand its international asset management business.
- The acquisition is expected to have limited effects on capital ratios and near-term earnings, with longer-term revenue diversification potential.
- Shares of Royal Bank of Canada face short- and medium-term selling pressure with a projected trading range of C$278.79 to C$289.53 and a 74% probability of further decline in the next two to three days.
International expansion ambitions weighed down by persistent selling pressure
Royal Bank of Canada has entered into an agreement to acquire full ownership of Australian asset manager Yarra Capital Management, according to PR Newswire. This transaction is intended to broaden RBC's international asset management presence and may offer longer-term revenue diversification, though the financial impact is projected to be limited for both capital ratios and near-term earnings. Despite the strategic rationale, price action has remained under broader selling pressure.
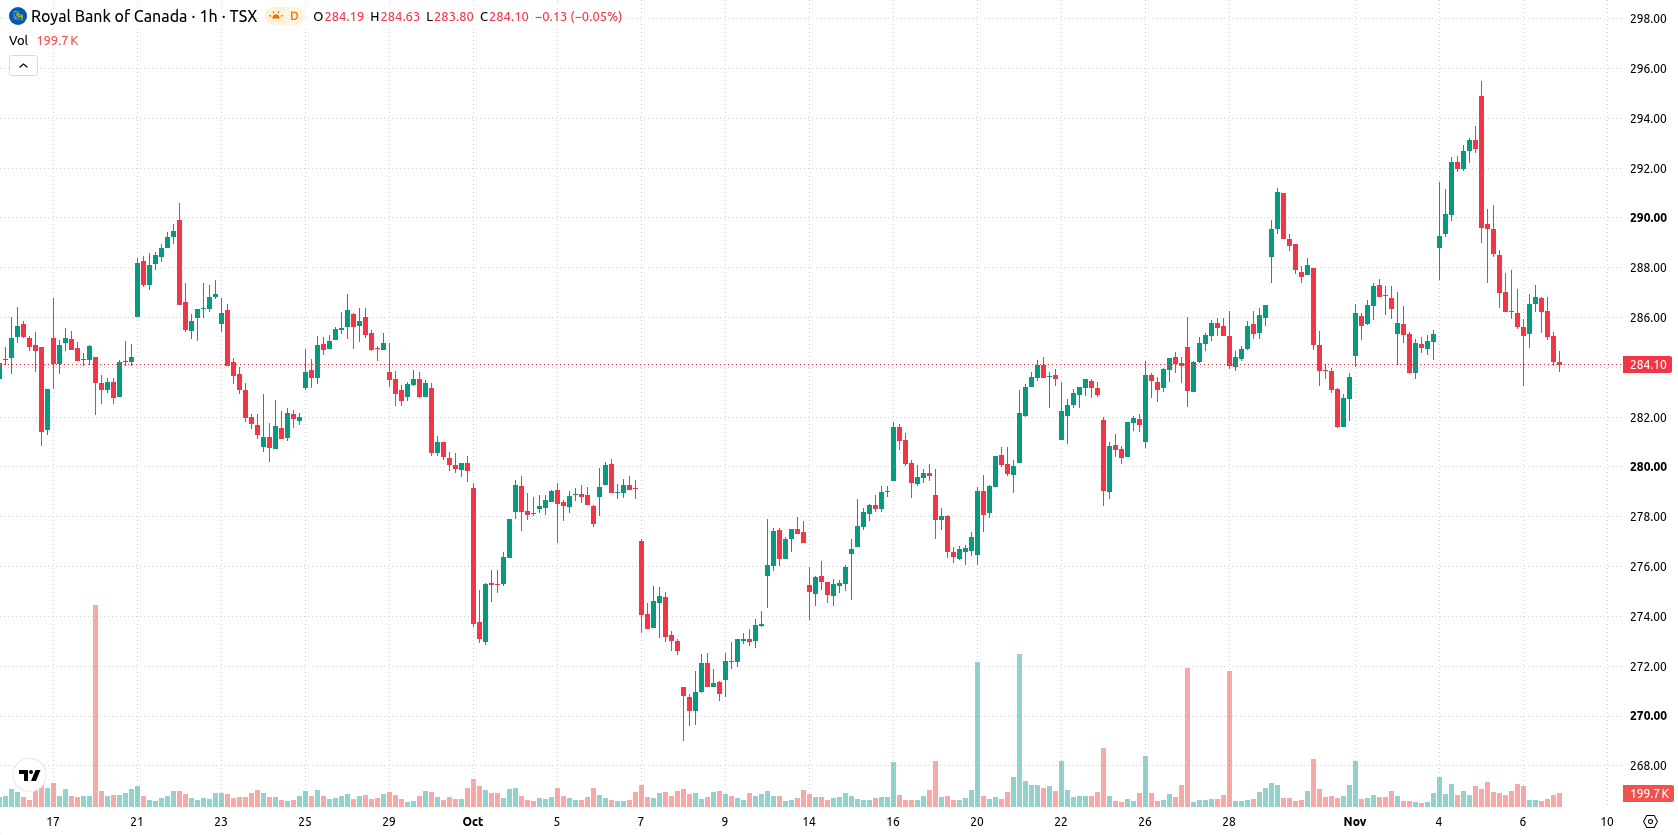
Bearish momentum persists as multiple indicators highlight oversold divergence
On the technical front, RY is trading below both the MA-20 and MA-50 on the hourly timeframe, while remaining above the MA-200 on the daily chart. The Ichimoku Kijun at C$289.37 serves as immediate resistance. MACD and ADX are both in Sell territory, and Bull/Bear Power reads -1.57, pointing to intraday seller dominance. RSI sits in the neutral range, while Stoch RSI and CCI are both oversold, indicating a potential for a short-term bounce rather than a confirmed reversal. The Awesome Oscillator direction is negative, reinforcing current bearish momentum, though intraday volatility remains moderate. Divergence is evident as oversold oscillators contrast with established bearish price action.
Rangebound outlook with downside bias unless resistance is breached
Over the next two to three sessions, RY is expected to trade within the C$278.79 to C$289.53 volatility band relative to current levels. The base case is for the price to remain rangebound, but with a 74% probability skewed toward further downside and only a 26% chance of a short-term recovery. Upside scenarios would require a break above the immediate resistance at C$289.37, while failure to hold the support at the lower end of the forecast corridor could trigger renewed selling momentum.
Previously it was reported that Royal Bank of Canada faced persistent short- and medium-term selling pressure but retained a bullish long-term structure. The latest technical signals affirm this underlying setup, with downside risk increasing and C$289.37 emerging as a pivotal resistance level for any potential shift in trend.










-
 Afghanistan
-
 Albania
-
 Algeria
-
 Angola
-
 Argentina
-
 Armenia
-
 Australia
-
 Austria
-
 Azerbaijan
-
 Bahamas
-
 Bahrain
-
 Bangladesh
-
 Belarus
-
 Belgium
-
 Bolivia
-
 Botswana
-
 Brazil
-
 Brunei
-
 Bulgaria
-
 Cambodia
-
 Cameroon
-
 Canada
-
 Chile
-
 China
-
 Colombia
-
 Congo
-
 Costa Rica
-
 Cote d'Ivoire
-
 Croatia
-
 Cuba
-
 Cyprus
-
 Czechia
-
 DR Congo
-
 Denmark
-
 Dominican Republic
-
 Ecuador
-
 Egypt
-
 El Salvador
-
 Estonia
-
 Eswatini
-
 Ethiopia
-
 Finland
-
 France
-
 Georgia
-
 Germany
-
 Ghana
-
 Greece
-
 Haiti
-
 Hong Kong
-
 Hungary
-
 India
-
 Indonesia
-
 Iran, Islamic republic
-
 Iraq
-
 Ireland
-
 Israel
-
 Italy
-
 Jamaica
-
 Japan
-
 Jordan
-
 Kazakhstan
-
 Kenya
-
 Korea
-
 Kuwait
-
 Kyrgyzstan
-
 Laos
-
 Latvia
-
 Lebanon
-
 Lesotho
-
 Libya
-
 Lithuania
-
 Luxembourg
-
 Madagascar
-
 Malaysia
-
 Malta
-
 Mauritius
-
 Mexico
-
 Moldova
-
 Mongolia
-
 Montenegro
-
 Morocco
-
 Mozambique
-
 Myanmar
-
 Namibia
-
 Nepal
-
 Netherlands
-
 New Zealand
-
 Nigeria
-
 North Macedonia
-
 Norway
-
 Oman
-
 Pakistan
-
 Palestine
-
 Panama
-
 Papua New Guinea
-
 Paraguay
-
 Peru
-
 Philippines
-
 Poland
-
 Portugal
-
 Puerto Rico
-
 Qatar
-
 Reunion
-
 Romania
-
 Rwanda
-
 Saudi Arabia
-
 Serbia
-
 Singapore
-
 Slovakia
-
 Slovenia
-
 Somalia
-
 South Africa
-
 Spain
-
 Sri Lanka
-
 Sweden
-
 Switzerland
-
 Syria
-
 Taiwan
-
 Tajikistan
-
 Tanzania
-
 Thailand
-
 Trinidad and Tobago
-
 Tunisia
-
 Turkey
-
 UAE
-
 Uganda
-
 Ukraine
-
 United Kingdom
-
United States
-
 Uruguay
-
 Uzbekistan
-
 Venezuela
-
 Vietnam
-
 Yemen
-
 Zambia
-
 Zimbabwe
- Forex
- Crypto












