

Alphabet stock forecast: Sideways trading expected as $286.78 resistance caps upside

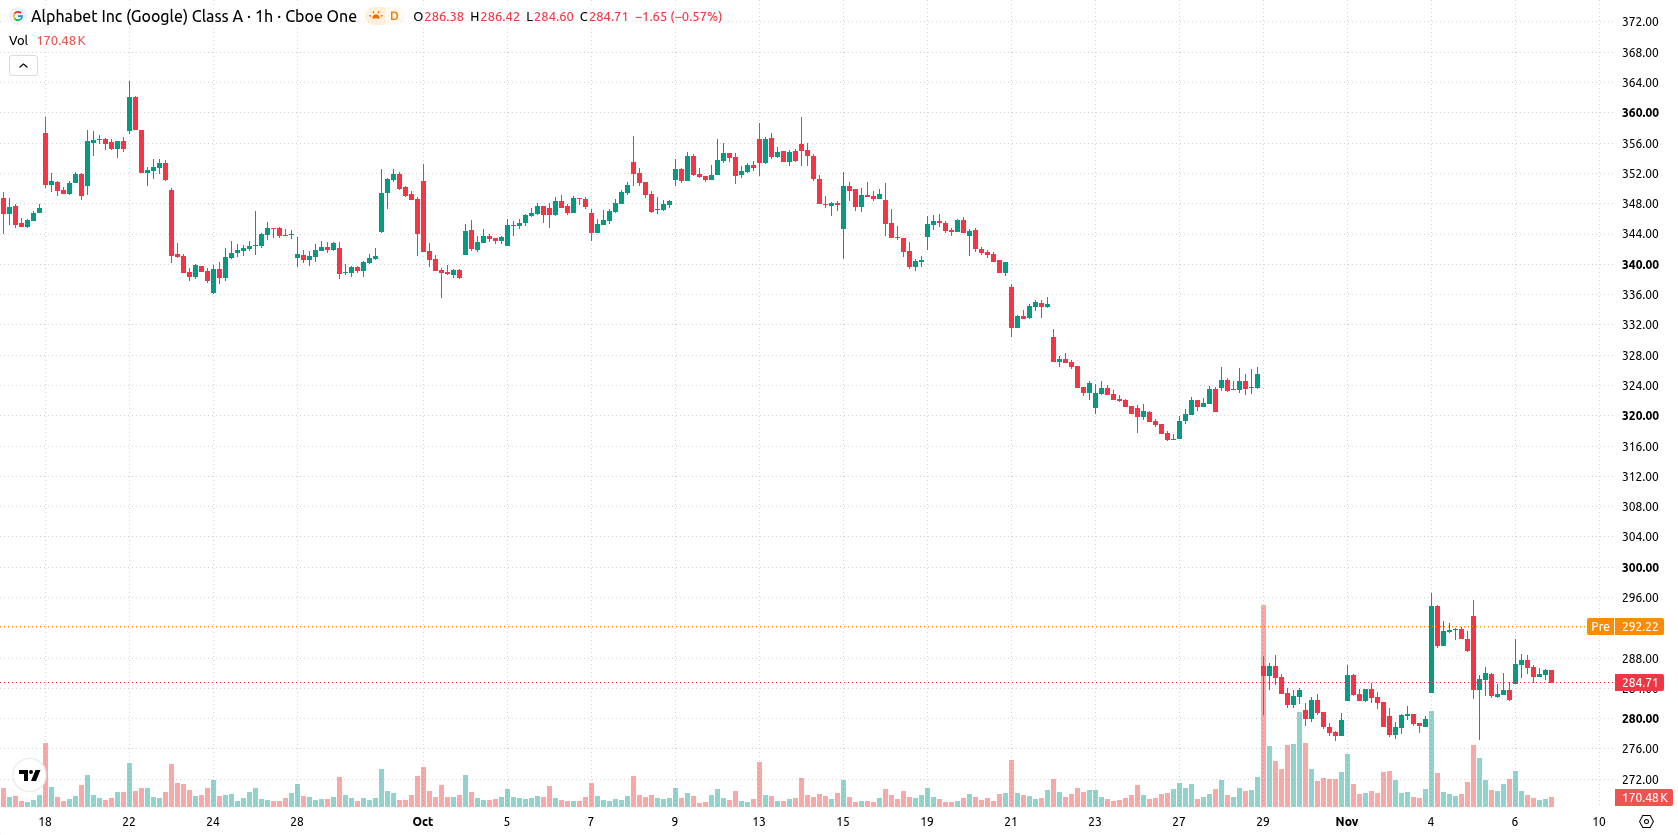
Alphabet (GOOGL) stock is trading at $284.8, posting a modest gain for the session. The price sits below its key short-term moving average, but just above the medium-term trend metric, reflecting a mixed technical stance early in the day.
 288.76
296.25
Highlights
- Alphabet stock has seen shifting momentum as regulatory scrutiny of artificial intelligence in the US creates uncertainty for future initiatives.
- Recent regulatory developments have affected trader reaction, causing sector-wide selling before the technology rebound started.
- Shares of Alphabet trade below key short-term averages with bearish momentum, and are expected to move between $276.29 to $293.31 in the coming days.
Regulatory scrutiny curbs sentiment as sector rebounds from weakness
Alphabet has experienced shifting momentum as the technology sector tentatively rebounds from a period of weakness, which was triggered by recent concerns over heightened US regulatory scrutiny of artificial intelligence development, according to Interactivecrypto. This regulatory focus has created uncertainty around future AI initiatives, affecting investor sentiment and sparking sector-wide selling before the current rebound began. As regulatory developments remain in focus, traders continue to respond to both perceived risks and the potential opportunities linked to evolving oversight.
Intraday resistance capped as momentum indicators signal softness
On the hourly chart, GOOGL is trading below the MA-20 and just above the MA-50, highlighting the $286.78 Ichimoku Kijun as immediate resistance. The long-term MA-200 is well above the current price, reinforcing a broader technical ceiling. MACD produces a strong sell signal, while ADX shows neutral trend strength. RSI, Stoch RSI, and CCI are all neutral, suggesting an absence of extreme buying or selling pressure. Bull/Bear Power is slightly positive at 0.55, hinting at minor intraday buyer activity even as the Awesome Oscillator remains neutral. Trading opened with a gap of 5 and is occurring near session lows amid moderate volatility.
Downside favored as sideways range constrains bullish prospects
In the short term, GOOGL is likely to fluctuate within the expected range of $276.29 to $293.31, with typical volatility around current levels. The probability of a sustained upward breakout is very low given existing momentum patterns, while a downward move has a very high probability, making an extended rally less likely. The baseline scenario points to sideways trading within this established band, with a bullish move only if price breaks above immediate resistance; conversely, a drop below support could signal further downside.
Previously it was reported that Google's potential compliance challenges under proposed Australian internet regulations could have broad implications for its core digital services. In light of Alphabet's current technical setup and sector-wide regulatory uncertainties, traders should monitor the $286.78 resistance level for potential directional cues as the prevailing scenario favors a continued range-bound trade with heightened downside risk if support levels give way.






Latest Google News





-
 Afghanistan
-
 Albania
-
 Algeria
-
 Angola
-
 Argentina
-
 Armenia
-
 Australia
-
 Austria
-
 Azerbaijan
-
 Bahamas
-
 Bahrain
-
 Bangladesh
-
 Belarus
-
 Belgium
-
 Bolivia
-
 Botswana
-
 Brazil
-
 Brunei
-
 Bulgaria
-
 Cambodia
-
 Cameroon
-
 Canada
-
 Chile
-
 China
-
 Colombia
-
 Congo
-
 Costa Rica
-
 Cote d'Ivoire
-
 Croatia
-
 Cuba
-
 Cyprus
-
 Czechia
-
 DR Congo
-
 Denmark
-
 Dominican Republic
-
 Ecuador
-
 Egypt
-
 El Salvador
-
 Estonia
-
 Eswatini
-
 Ethiopia
-
 Finland
-
 France
-
 Georgia
-
 Germany
-
 Ghana
-
 Greece
-
 Haiti
-
 Hong Kong
-
 Hungary
-
 India
-
 Indonesia
-
 Iran, Islamic republic
-
 Iraq
-
 Ireland
-
 Israel
-
 Italy
-
 Jamaica
-
 Japan
-
 Jordan
-
 Kazakhstan
-
 Kenya
-
 Korea
-
 Kuwait
-
 Kyrgyzstan
-
 Laos
-
 Latvia
-
 Lebanon
-
 Lesotho
-
 Libya
-
 Lithuania
-
 Luxembourg
-
 Madagascar
-
 Malaysia
-
 Malta
-
 Mauritius
-
 Mexico
-
 Moldova
-
 Mongolia
-
 Montenegro
-
 Morocco
-
 Mozambique
-
 Myanmar
-
 Namibia
-
 Nepal
-
 Netherlands
-
 New Zealand
-
 Nigeria
-
 North Macedonia
-
 Norway
-
 Oman
-
 Pakistan
-
 Palestine
-
 Panama
-
 Papua New Guinea
-
 Paraguay
-
 Peru
-
 Philippines
-
 Poland
-
 Portugal
-
 Puerto Rico
-
 Qatar
-
 Reunion
-
 Romania
-
 Rwanda
-
 Saudi Arabia
-
 Serbia
-
 Singapore
-
 Slovakia
-
 Slovenia
-
 Somalia
-
 South Africa
-
 Spain
-
 Sri Lanka
-
 Sweden
-
 Switzerland
-
 Syria
-
 Taiwan
-
 Tajikistan
-
 Tanzania
-
 Thailand
-
 Trinidad and Tobago
-
 Tunisia
-
 Turkey
-
 UAE
-
 Uganda
-
 Ukraine
-
 United Kingdom
-
United States
-
 Uruguay
-
 Uzbekistan
-
 Venezuela
-
 Vietnam
-
 Yemen
-
 Zambia
-
 Zimbabwe
- Forex
- Crypto












