

TELUS stock consolidates as minor seller dominance counters buyer support near C$12.33 support

TELUS Corporation (T) stock is trading at C$12.7, with a modest daily decline driven by selling pressure. The price currently sits below its short-term moving average but remains above the medium-term average.
 12.83
13.25
Highlights
- TELUS reported third-quarter earnings per share of C$0.16 on revenue of C$5.02 billion, missing market estimates by 5.9%.
- Management plans to achieve CAD 900 million in annualized cost savings over two years through cost reductions and asset sales.
- Shares of TELUS closed at C$12.7, with technical signals mixed and the expected range over four days at C$12.33 to C$13.07.
Cost-saving push and dividend stability follow earnings miss
TELUS reported third-quarter 2026 earnings per share of C$0.16 and revenue of C$5.02 billion, missing market estimates by 5.9%, according to Thecerbatgem. The earnings shortfall highlights ongoing challenges in delivering top-line growth, which may temper expectations for near-term performance. Management has meanwhile announced a plan for CAD 900 million in annualized cost savings over the next two years through measures such as cost reductions and asset sales, aimed at enhancing financial flexibility, as reported by Thecerbatgem. TELUS also reaffirmed its quarterly dividend of CAD 0.1875 per share, with the stated aim of maintaining yield for investors despite a reset earlier this year, as noted by Yahoo Finance.
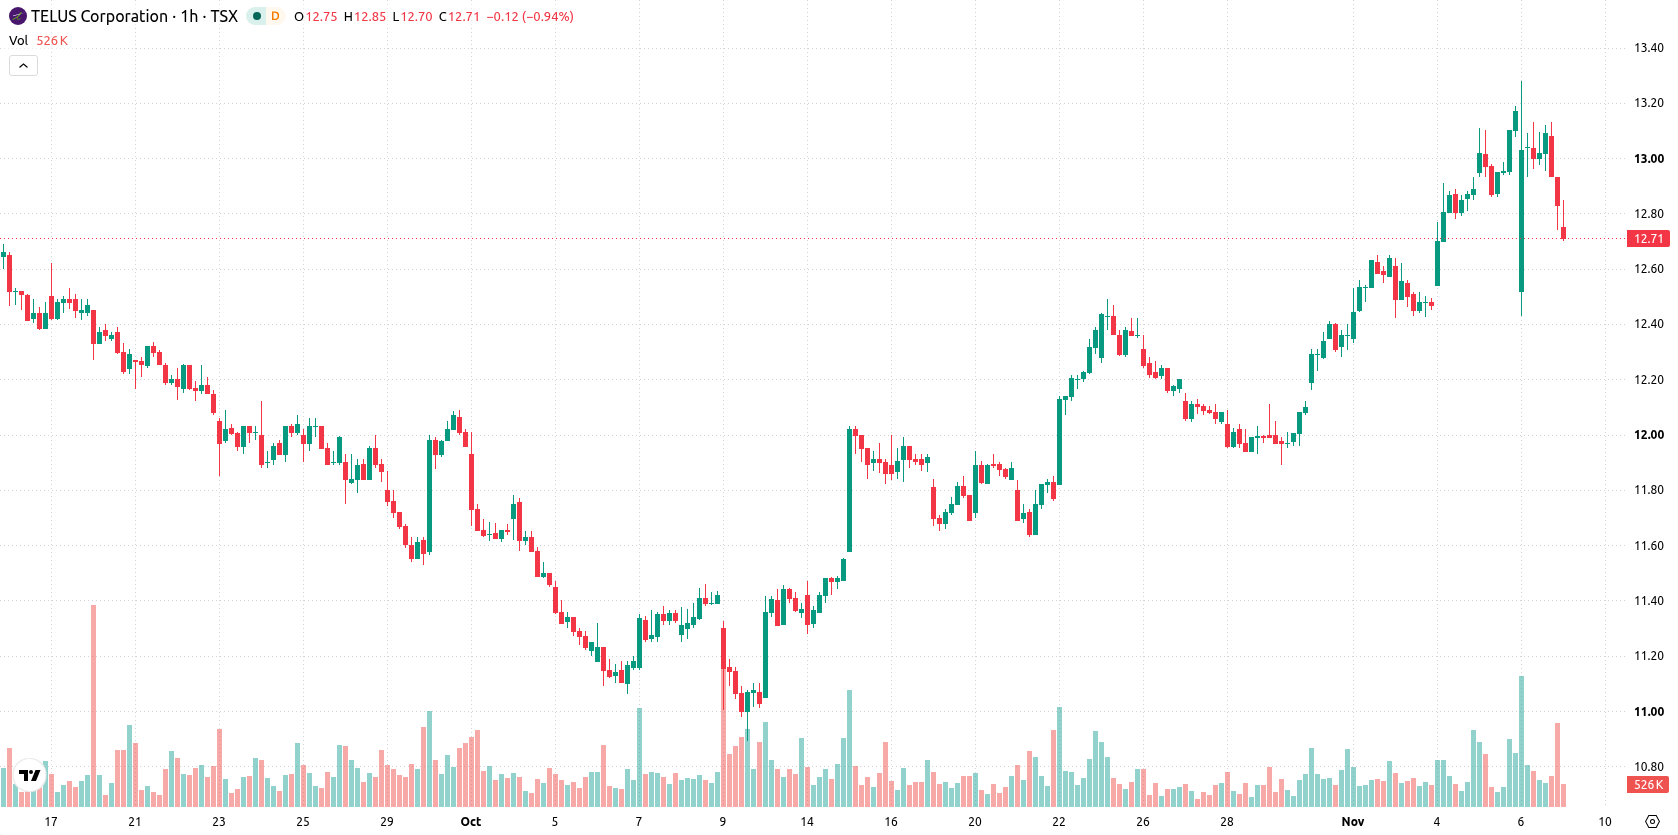
Mixed momentum signals as resistance tests cap upside
On the working (h1) timeframe, T is positioned below its MA-20 at C$12.95 but above the MA-50 at C$12.59, while remaining well beneath the long-term MA-200 at C$15.61. The immediate resistance is defined by the Ichimoku Kijun at C$12.86, with support at C$12.33 and major resistance at C$13.07. RSI and CCI both suggest a neutral stance, whereas Stoch RSI signals an oversold condition. MACD points to strong buy momentum, but the ADX provides a contrasting sell signal. Bull/Bear Power is marginally negative at -0.02, and the Awesome Oscillator remains neutral, indicating mixed signals and minor intraday seller dominance.
Consolidation expected as range-bound risks dominate outlook
Over the next four trading days, T is projected to consolidate within the typical volatility band of C$12.33 to C$13.07. There is a 57% probability of a downward move and a 43% likelihood of an upward breakout. The baseline scenario favors price action staying inside this consolidation corridor. A bullish break above the C$12.86–C$13.07 resistance zone would open scope for upside momentum, while a drop below C$12.33 would increase downside risk.
Earlier, analysts noted that TELUS faced both profitability challenges and restructuring moves, leaving its near-term outlook cautious and reliant on technical breakouts. The latest results and price action add nuance to this view, with traders advised to monitor the C$12.33 support level for signs of further downside risk in the coming sessions.










-
 Afghanistan
-
 Albania
-
 Algeria
-
 Angola
-
 Argentina
-
 Armenia
-
 Australia
-
 Austria
-
 Azerbaijan
-
 Bahamas
-
 Bahrain
-
 Bangladesh
-
 Belarus
-
 Belgium
-
 Bolivia
-
 Botswana
-
 Brazil
-
 Brunei
-
 Bulgaria
-
 Cambodia
-
 Cameroon
-
 Canada
-
 Chile
-
 China
-
 Colombia
-
 Congo
-
 Costa Rica
-
 Cote d'Ivoire
-
 Croatia
-
 Cuba
-
 Cyprus
-
 Czechia
-
 DR Congo
-
 Denmark
-
 Dominican Republic
-
 Ecuador
-
 Egypt
-
 El Salvador
-
 Estonia
-
 Eswatini
-
 Ethiopia
-
 Finland
-
 France
-
 Georgia
-
 Germany
-
 Ghana
-
 Greece
-
 Haiti
-
 Hong Kong
-
 Hungary
-
 India
-
 Indonesia
-
 Iran, Islamic republic
-
 Iraq
-
 Ireland
-
 Israel
-
 Italy
-
 Jamaica
-
 Japan
-
 Jordan
-
 Kazakhstan
-
 Kenya
-
 Korea
-
 Kuwait
-
 Kyrgyzstan
-
 Laos
-
 Latvia
-
 Lebanon
-
 Lesotho
-
 Libya
-
 Lithuania
-
 Luxembourg
-
 Madagascar
-
 Malaysia
-
 Malta
-
 Mauritius
-
 Mexico
-
 Moldova
-
 Mongolia
-
 Montenegro
-
 Morocco
-
 Mozambique
-
 Myanmar
-
 Namibia
-
 Nepal
-
 Netherlands
-
 New Zealand
-
 Nigeria
-
 North Macedonia
-
 Norway
-
 Oman
-
 Pakistan
-
 Palestine
-
 Panama
-
 Papua New Guinea
-
 Paraguay
-
 Peru
-
 Philippines
-
 Poland
-
 Portugal
-
 Puerto Rico
-
 Qatar
-
 Reunion
-
 Romania
-
 Rwanda
-
 Saudi Arabia
-
 Serbia
-
 Singapore
-
 Slovakia
-
 Slovenia
-
 Somalia
-
 South Africa
-
 Spain
-
 Sri Lanka
-
 Sweden
-
 Switzerland
-
 Syria
-
 Taiwan
-
 Tajikistan
-
 Tanzania
-
 Thailand
-
 Trinidad and Tobago
-
 Tunisia
-
 Turkey
-
 UAE
-
 Uganda
-
 Ukraine
-
 United Kingdom
-
United States
-
 Uruguay
-
 Uzbekistan
-
 Venezuela
-
 Vietnam
-
 Yemen
-
 Zambia
-
 Zimbabwe
- Forex
- Crypto












