


S&P 500 Index (SPX) rallied 1.99% after third-quarter earnings growth and widespread beats refocused attention on the index's corporate strength. The rebound looks limited, with the index still trading below its 20-day and 50-day moving averages, highlighting ongoing near- and medium-term resistance.
 7576.01
7714.32
Highlights
- Earnings growth in the S&P 500 slowed as 88% of companies reported a 26% overall increase this quarter.
- 84% of companies exceeded earnings forecasts, but the average surprise was the weakest in four years at 2.7%.
- The S&P 500 trades below short-term moving averages with mixed technical signals and is expected to range from 7,345 to 7,705 in the next five days.
Weaker earnings surprises temper optimism amid sector rotation
Earnings growth for the S&P 500 slowed this quarter, with 88% of companies reporting and overall earnings increasing by 26%, according to Oppenheimer. FactSet data shows 84% of companies exceeded earnings forecasts, though the average surprise of 2.7% marked the weakest result in four years. Double-digit revenue gains and year-over-year earnings growth remain, with Q3 earnings expected to rise 28.4% from last year. The period also saw the index breach key support levels and sector rotation impact technology and consumer-focused stocks.
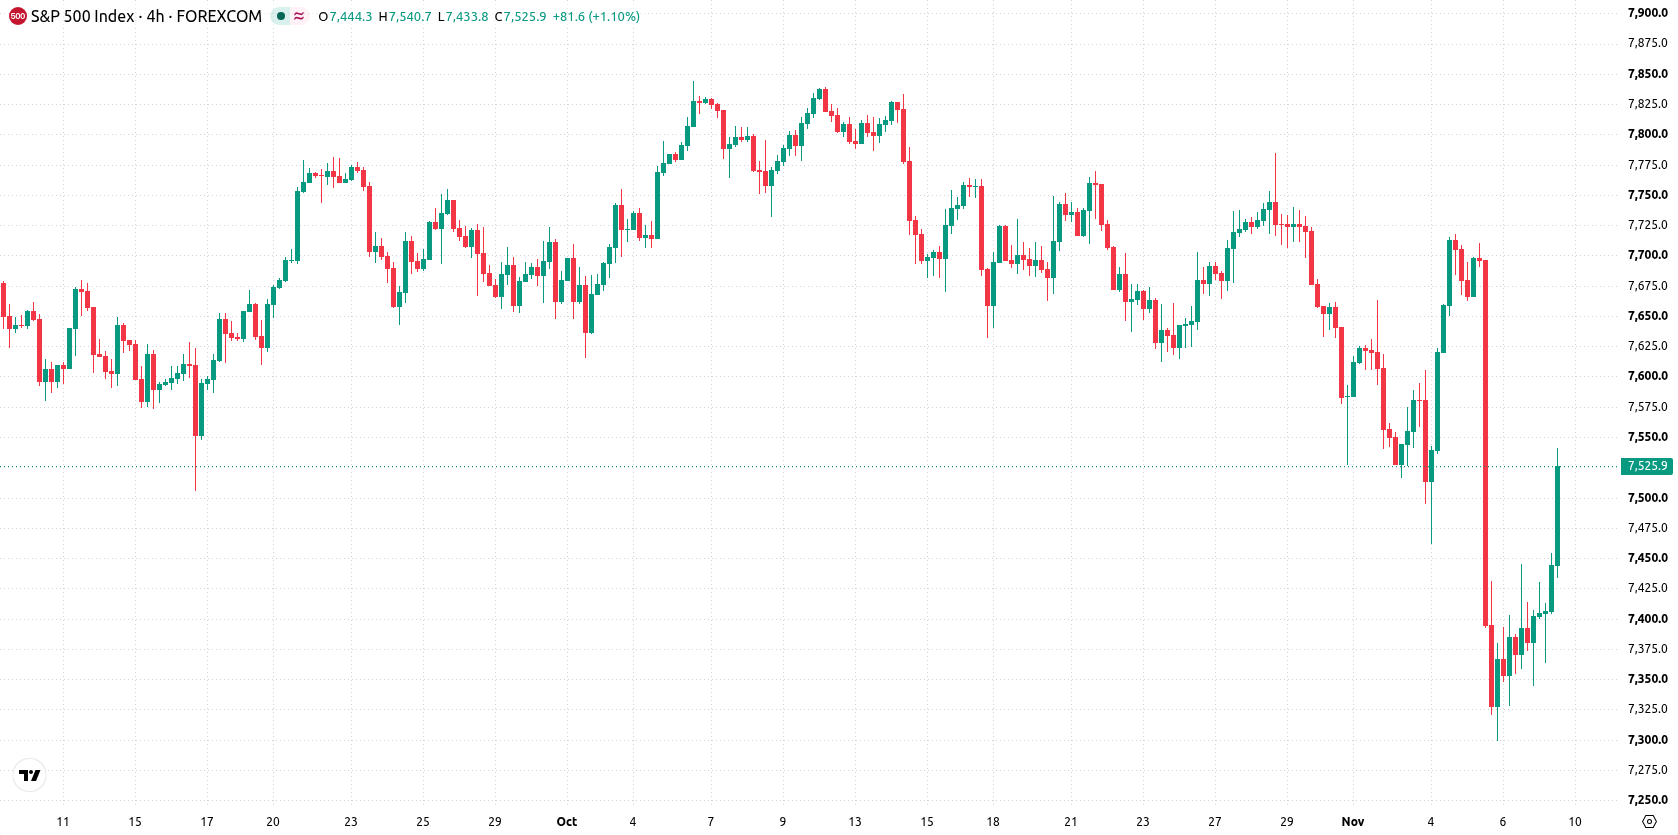
Mixed momentum signals with selling pressure below key averages
The S&P 500 trades below its 20-day and 50-day moving averages at 7,657 and 7,679, while holding above its 200-day average at 7,324. This structure shows selling pressure in the near and medium term but a bullish bias in the long term. Nearest resistance is at 7,598, with immediate support at 7,441. Momentum signals are mixed; MACD shows a bearish bias and the ADX indicates the prevailing trend is weak. The RSI is neutral. However, the Stochastic RSI and Commodity Channel Index (CCI) enter oversold zones, suggesting possible selling exhaustion and rebound risk. The Awesome Oscillator and Bull/Bear Power (BBP) both indicate intraday selling pressure.
Earlier, analysts noted that the recent technology-led correction had improved the risk-reward profile for a potential S&P 500 rebound heading into year-end. The latest data, with mixed momentum signals and signs of selling exhaustion, suggest traders should monitor the 7,598 resistance and 7,441 support for indication of the next directional move.






Latest S&P 500 News




-
 Afghanistan
-
 Albania
-
 Algeria
-
 Angola
-
 Argentina
-
 Armenia
-
 Australia
-
 Austria
-
 Azerbaijan
-
 Bahamas
-
 Bahrain
-
 Bangladesh
-
 Belarus
-
 Belgium
-
 Bolivia
-
 Botswana
-
 Brazil
-
 Brunei
-
 Bulgaria
-
 Cambodia
-
 Cameroon
-
 Canada
-
 Chile
-
 China
-
 Colombia
-
 Congo
-
 Costa Rica
-
 Cote d'Ivoire
-
 Croatia
-
 Cuba
-
 Cyprus
-
 Czechia
-
 DR Congo
-
 Denmark
-
 Dominican Republic
-
 Ecuador
-
 Egypt
-
 El Salvador
-
 Estonia
-
 Eswatini
-
 Ethiopia
-
 Finland
-
 France
-
 Georgia
-
 Germany
-
 Ghana
-
 Greece
-
 Haiti
-
 Hong Kong
-
 Hungary
-
 India
-
 Indonesia
-
 Iran, Islamic republic
-
 Iraq
-
 Ireland
-
 Israel
-
 Italy
-
 Jamaica
-
 Japan
-
 Jordan
-
 Kazakhstan
-
 Kenya
-
 Korea
-
 Kuwait
-
 Kyrgyzstan
-
 Laos
-
 Latvia
-
 Lebanon
-
 Lesotho
-
 Libya
-
 Lithuania
-
 Luxembourg
-
 Madagascar
-
 Malaysia
-
 Malta
-
 Mauritius
-
 Mexico
-
 Moldova
-
 Mongolia
-
 Montenegro
-
 Morocco
-
 Mozambique
-
 Myanmar
-
 Namibia
-
 Nepal
-
 Netherlands
-
 New Zealand
-
 Nigeria
-
 North Macedonia
-
 Norway
-
 Oman
-
 Pakistan
-
 Palestine
-
 Panama
-
 Papua New Guinea
-
 Paraguay
-
 Peru
-
 Philippines
-
 Poland
-
 Portugal
-
 Puerto Rico
-
 Qatar
-
 Reunion
-
 Romania
-
 Rwanda
-
 Saudi Arabia
-
 Serbia
-
 Singapore
-
 Slovakia
-
 Slovenia
-
 Somalia
-
 South Africa
-
 Spain
-
 Sri Lanka
-
 Sweden
-
 Switzerland
-
 Syria
-
 Taiwan
-
 Tajikistan
-
 Tanzania
-
 Thailand
-
 Trinidad and Tobago
-
 Tunisia
-
 Turkey
-
 UAE
-
 Uganda
-
 Ukraine
-
 United Kingdom
-
United States
-
 Uruguay
-
 Uzbekistan
-
 Venezuela
-
 Vietnam
-
 Yemen
-
 Zambia
-
 Zimbabwe
- Forex
- Crypto












