

What's behind Manulife Financial's latest 2.8% stock surge?

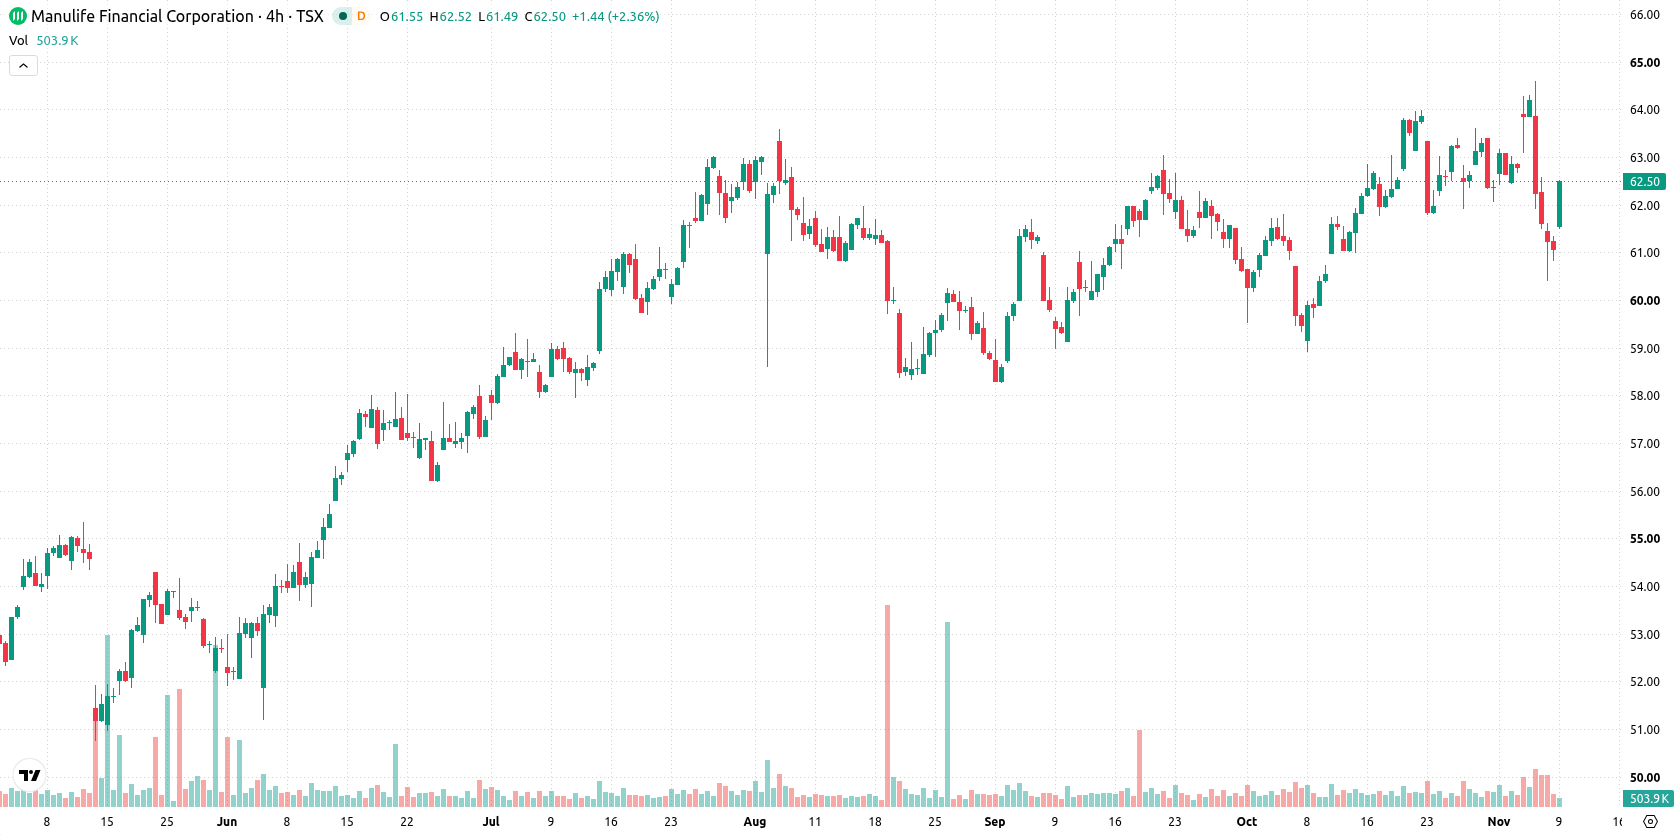
Manulife Financial Corporation (MFC) jumped 2.76% after reporting record core earnings and continued shareholder returns for the quarter, which helped fuel renewed buying interest. This upmove is supported by strong technical momentum, with the stock trading above all major moving averages and near-term support holding firm.
 61.55
64.57
Highlights
- Manulife Financial reported record core earnings of CAD 2.125 billion for the September 30, 2025 quarter, with core EPS up 6%.
- The company returned CAD 5.3 billion to shareholders over 12 months, maintained a 136% LICAT capital ratio, and kept a 3.08% dividend yield.
- Shares of Manulife trade above key moving averages, with mixed technicals signaling potential for a sideways price range of C$60.63 to C$64.79 over the next five days.
Shareholder returns sustained as market experience and charges weigh on income
Manulife Financial reported record core earnings of CAD 2.125 billion for the September 30, 2025 quarter, with a 6% increase in core earnings per share partly boosted by share buybacks. Net income was affected by negative market experience and a one-time charge related to Vietnam. Across the recent 12 months, Manulife returned CAD 5.3 billion to shareholders, maintained a strong 136% LICAT capital ratio, and kept its dividend yield at 3.08%. The company also extended its partnership with Microsoft for five years, expanded AI-enhanced advisory tools in Asia, increased automation in U.S. wealth operations, and broadened its asset management product suite with new ETF-based mutual funds.
Bullish moving averages offset by mixed momentum and intraday indecision
MFC is trading above its 20-day, 50-day, and 200-day moving averages, with the current price of C$62.71 above the C$62.44 (MA-20), C$61.43 (MA-50), and C$55.77 (MA-200) levels. This moving average alignment highlights ongoing bullish momentum across all timeframes, and the MA-50 vs MA-200 structure signals a bullish long-term trend. The immediate technical floor lies at C$62.44 (MA-20) with the ceiling at C$64.57 (week high), while the Ichimoku Kijun at C$61.75 provides additional support. MACD shows strong bullish momentum, though the Average Directional Index (ADX) is neutral, indicating trend strength is limited. The Relative Strength Index (RSI) is neutral, both the Stochastic RSI and Commodity Channel Index (CCI) are in oversold zones suggesting a rebound risk, and the Bull/Bear Power (BBP) is negative, pointing to intraday seller dominance. The Awesome Oscillator (AO) is neutral and does not confirm any trend. The stock opened with an upside gap of 0.85% and has traded at a single level, displaying no intraday volatility so far. Mixed oscillator signals hint at potential indecision after the initial move.
Earlier, analysts noted that Manulife Financial's outlook was shaped by persistent short-term technical challenges offset by longer-term support and improving earnings. The current analysis adds that, despite recent bullish momentum and strategic initiatives, traders should monitor the C$64.57 resistance as a potential catalyst for renewed upside, while a drop below C$62.44 could shift the risk toward a move down to C$60.63.






Latest Manulife Financial News




-
 Afghanistan
-
 Albania
-
 Algeria
-
 Angola
-
 Argentina
-
 Armenia
-
 Australia
-
 Austria
-
 Azerbaijan
-
 Bahamas
-
 Bahrain
-
 Bangladesh
-
 Belarus
-
 Belgium
-
 Bolivia
-
 Botswana
-
 Brazil
-
 Brunei
-
 Bulgaria
-
 Cambodia
-
 Cameroon
-
 Canada
-
 Chile
-
 China
-
 Colombia
-
 Congo
-
 Costa Rica
-
 Cote d'Ivoire
-
 Croatia
-
 Cuba
-
 Cyprus
-
 Czechia
-
 DR Congo
-
 Denmark
-
 Dominican Republic
-
 Ecuador
-
 Egypt
-
 El Salvador
-
 Estonia
-
 Eswatini
-
 Ethiopia
-
 Finland
-
 France
-
 Georgia
-
 Germany
-
 Ghana
-
 Greece
-
 Haiti
-
 Hong Kong
-
 Hungary
-
 India
-
 Indonesia
-
 Iran, Islamic republic
-
 Iraq
-
 Ireland
-
 Israel
-
 Italy
-
 Jamaica
-
 Japan
-
 Jordan
-
 Kazakhstan
-
 Kenya
-
 Korea
-
 Kuwait
-
 Kyrgyzstan
-
 Laos
-
 Latvia
-
 Lebanon
-
 Lesotho
-
 Libya
-
 Lithuania
-
 Luxembourg
-
 Madagascar
-
 Malaysia
-
 Malta
-
 Mauritius
-
 Mexico
-
 Moldova
-
 Mongolia
-
 Montenegro
-
 Morocco
-
 Mozambique
-
 Myanmar
-
 Namibia
-
 Nepal
-
 Netherlands
-
 New Zealand
-
 Nigeria
-
 North Macedonia
-
 Norway
-
 Oman
-
 Pakistan
-
 Palestine
-
 Panama
-
 Papua New Guinea
-
 Paraguay
-
 Peru
-
 Philippines
-
 Poland
-
 Portugal
-
 Puerto Rico
-
 Qatar
-
 Reunion
-
 Romania
-
 Rwanda
-
 Saudi Arabia
-
 Serbia
-
 Singapore
-
 Slovakia
-
 Slovenia
-
 Somalia
-
 South Africa
-
 Spain
-
 Sri Lanka
-
 Sweden
-
 Switzerland
-
 Syria
-
 Taiwan
-
 Tajikistan
-
 Tanzania
-
 Thailand
-
 Trinidad and Tobago
-
 Tunisia
-
 Turkey
-
 UAE
-
 Uganda
-
 Ukraine
-
 United Kingdom
-
United States
-
 Uruguay
-
 Uzbekistan
-
 Venezuela
-
 Vietnam
-
 Yemen
-
 Zambia
-
 Zimbabwe
- Forex
- Crypto












